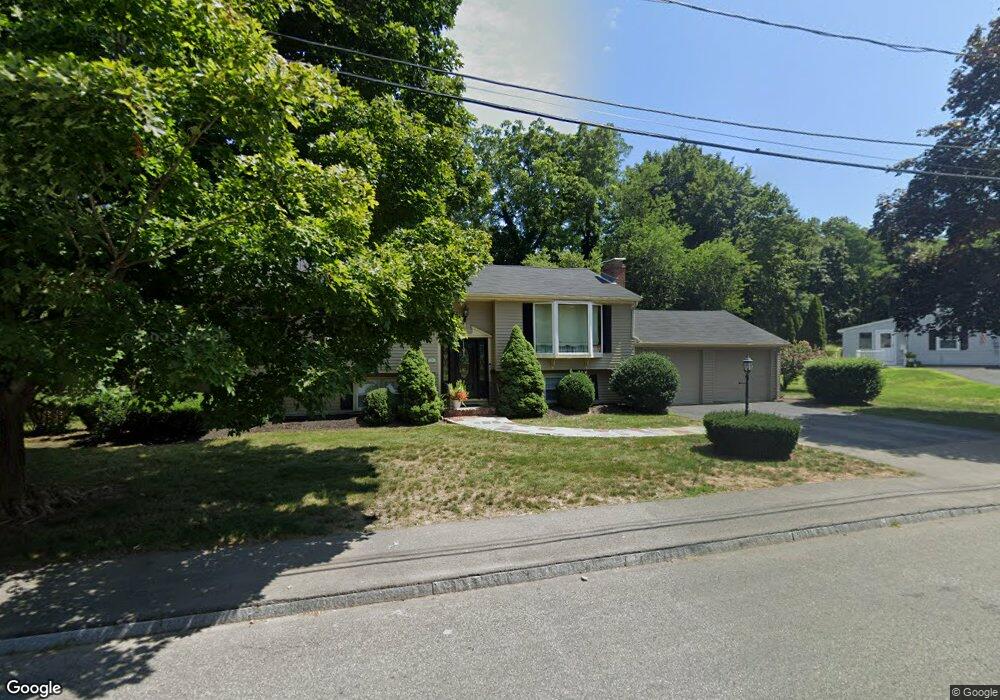
21 Louise Rd Braintree, MA 02184
East Braintree NeighborhoodEstimated Value: $874,838 - $958,000
4
Beds
3
Baths
2,268
Sq Ft
$403/Sq Ft
Est. Value
About This Home
This home is located at 21 Louise Rd, Braintree, MA 02184 and is currently estimated at $913,210, approximately $402 per square foot. 21 Louise Rd is a home located in Norfolk County with nearby schools including Braintree High School, Sacred Heart Elementary School, and South Shore Christian Academy.
Ownership History
Date
Name
Owned For
Owner Type
Purchase Details
Closed on
Apr 23, 2025
Sold by
Price Scott W and Price Donna M
Bought by
Scott W Price Ret and Price
Current Estimated Value
Purchase Details
Closed on
Jan 29, 1999
Sold by
Young James D
Bought by
Price Scott W and Price Donna M
Home Financials for this Owner
Home Financials are based on the most recent Mortgage that was taken out on this home.
Original Mortgage
$167,000
Interest Rate
6.67%
Mortgage Type
Purchase Money Mortgage
Create a Home Valuation Report for This Property
The Home Valuation Report is an in-depth analysis detailing your home's value as well as a comparison with similar homes in the area
Home Values in the Area
Average Home Value in this Area
Purchase History
| Date | Buyer | Sale Price | Title Company |
|---|---|---|---|
| Scott W Price Ret | -- | None Available | |
| Scott W Price Ret | -- | None Available | |
| Price Scott W | $278,000 | -- |
Source: Public Records
Mortgage History
| Date | Status | Borrower | Loan Amount |
|---|---|---|---|
| Previous Owner | Price Scott W | $25,000 | |
| Previous Owner | Price Scott W | $167,000 |
Source: Public Records
Tax History
| Year | Tax Paid | Tax Assessment Tax Assessment Total Assessment is a certain percentage of the fair market value that is determined by local assessors to be the total taxable value of land and additions on the property. | Land | Improvement |
|---|---|---|---|---|
| 2025 | $8,113 | $812,900 | $401,900 | $411,000 |
| 2024 | $7,228 | $762,400 | $370,200 | $392,200 |
| 2023 | $6,911 | $708,100 | $338,500 | $369,600 |
| 2022 | $6,624 | $665,700 | $296,100 | $369,600 |
| 2021 | $6,228 | $625,900 | $267,600 | $358,300 |
| 2020 | $5,932 | $601,600 | $243,300 | $358,300 |
| 2019 | $5,736 | $568,500 | $243,300 | $325,200 |
| 2018 | $5,505 | $522,300 | $211,500 | $310,800 |
| 2017 | $5,326 | $495,900 | $201,000 | $294,900 |
| 2016 | $5,214 | $474,900 | $190,400 | $284,500 |
| 2015 | $5,185 | $468,400 | $186,100 | $282,300 |
| 2014 | $4,697 | $411,300 | $161,800 | $249,500 |
Source: Public Records
Map
Nearby Homes
- 31 Doris Rd
- 36 Chestnut Ave
- 300 Commercial St Unit 23
- 37 Lantern Ln
- 41 Lantern Ln
- 50 Cleveland Ave
- 82 Lester Ln
- 15 Summer St
- 255 River St
- 26 Tingley Rd
- 122 Washington St Unit Twenty-two
- 11 Richmond St
- 25 Richmond St
- 5 Woodsum Dr Unit 12
- 20 Vine St
- 33 Congress St
- 54 Edgemont Rd
- 418 John Mahar Hwy Unit 408
- 426 John Mahar Hwy Unit 311
- 469-471 Washington St
Your Personal Tour Guide
Ask me questions while you tour the home.