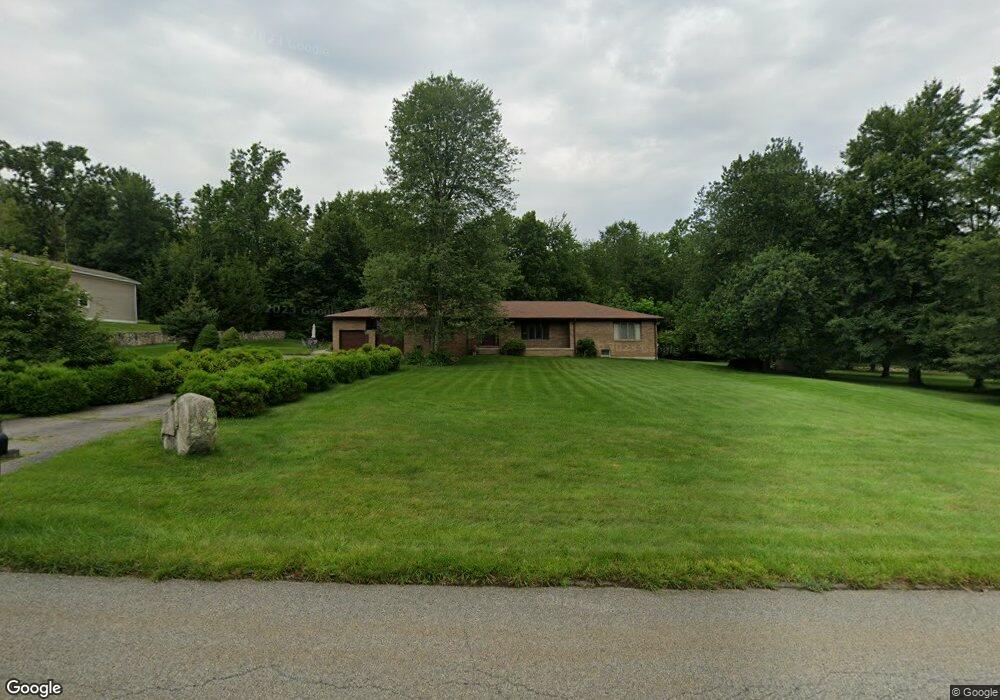
21 Lounsbury Dr Baldwin Place, NY 10505
Estimated Value: $748,000 - $991,000
3
Beds
2
Baths
2,598
Sq Ft
$330/Sq Ft
Est. Value
About This Home
This home is located at 21 Lounsbury Dr, Baldwin Place, NY 10505 and is currently estimated at $856,924, approximately $329 per square foot. 21 Lounsbury Dr is a home located in Westchester County with nearby schools including Somers Intermediate School, Somers Middle School, and Somers Senior High School.
Ownership History
Date
Name
Owned For
Owner Type
Purchase Details
Closed on
Aug 11, 2017
Sold by
Lenci Vincent and Estate Of Margaret Lenci
Bought by
Finella Mary Anne and Finella Peter A
Current Estimated Value
Home Financials for this Owner
Home Financials are based on the most recent Mortgage that was taken out on this home.
Original Mortgage
$202,000
Interest Rate
3.89%
Mortgage Type
New Conventional
Purchase Details
Closed on
Mar 4, 2013
Sold by
Finella John and Finella Michelle
Bought by
Finella John
Purchase Details
Closed on
Nov 6, 1998
Sold by
Finella Giovannina and Finella Giovanni
Bought by
Finella John and Finella Michelle
Home Financials for this Owner
Home Financials are based on the most recent Mortgage that was taken out on this home.
Original Mortgage
$115,000
Interest Rate
6.8%
Create a Home Valuation Report for This Property
The Home Valuation Report is an in-depth analysis detailing your home's value as well as a comparison with similar homes in the area
Home Values in the Area
Average Home Value in this Area
Purchase History
| Date | Buyer | Sale Price | Title Company |
|---|---|---|---|
| Finella Mary Anne | $402,000 | Pro National Title Agency | |
| Finella John | -- | Judicial Title Ins | |
| Finella John | $335,000 | Chicago Title Insurance Co |
Source: Public Records
Mortgage History
| Date | Status | Borrower | Loan Amount |
|---|---|---|---|
| Previous Owner | Finella Mary Anne | $202,000 | |
| Previous Owner | Finella John | $115,000 |
Source: Public Records
Tax History Compared to Growth
Tax History
| Year | Tax Paid | Tax Assessment Tax Assessment Total Assessment is a certain percentage of the fair market value that is determined by local assessors to be the total taxable value of land and additions on the property. | Land | Improvement |
|---|---|---|---|---|
| 2024 | $13,840 | $64,800 | $13,700 | $51,100 |
| 2023 | $13,251 | $64,800 | $13,700 | $51,100 |
| 2022 | $12,921 | $64,800 | $13,700 | $51,100 |
| 2021 | $12,693 | $64,800 | $13,700 | $51,100 |
| 2020 | $12,382 | $64,800 | $13,700 | $51,100 |
| 2019 | $13,824 | $64,800 | $13,700 | $51,100 |
| 2018 | $14,679 | $64,800 | $13,700 | $51,100 |
| 2017 | $2,895 | $64,800 | $13,700 | $51,100 |
| 2016 | $11,558 | $64,800 | $13,700 | $51,100 |
| 2015 | -- | $64,800 | $13,700 | $51,100 |
| 2014 | -- | $64,800 | $13,700 | $51,100 |
| 2013 | -- | $64,800 | $13,700 | $51,100 |
Source: Public Records
Map
Nearby Homes