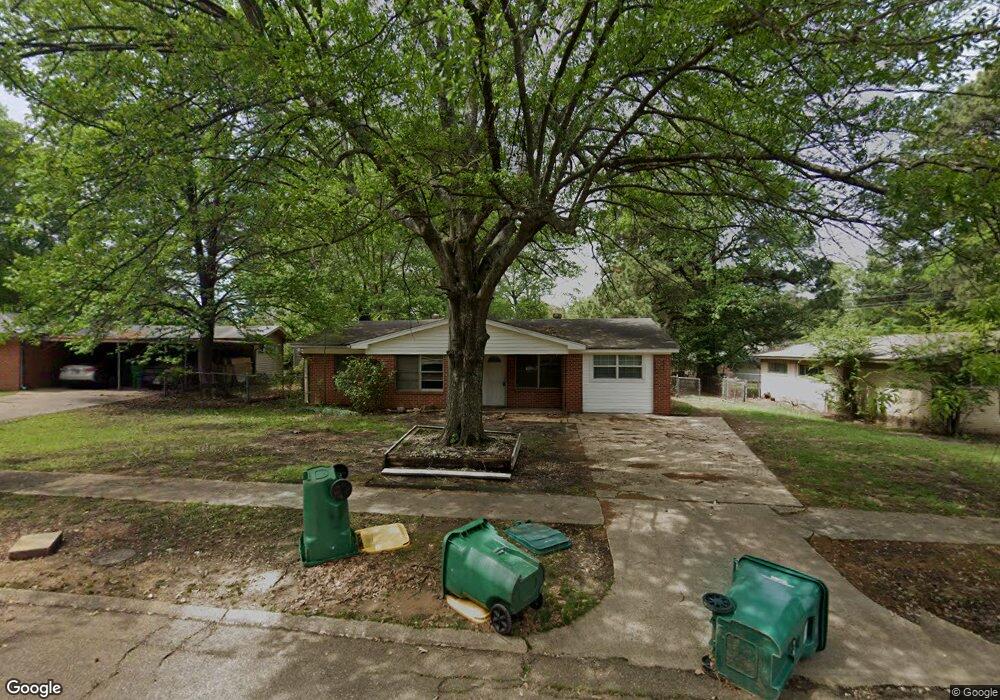
21 Lynwood Dr Texarkana, TX 75503
Estimated Value: $133,397 - $191,000
--
Bed
--
Bath
1,420
Sq Ft
$114/Sq Ft
Est. Value
About This Home
This home is located at 21 Lynwood Dr, Texarkana, TX 75503 and is currently estimated at $162,099, approximately $114 per square foot. 21 Lynwood Dr is a home located in Bowie County with nearby schools including Spring Lake Park Elementary School, Texas Middle School, and Texas High School.
Ownership History
Date
Name
Owned For
Owner Type
Purchase Details
Closed on
Nov 5, 2018
Sold by
Wrenco Inc
Bought by
Ltc 4M Llc
Current Estimated Value
Home Financials for this Owner
Home Financials are based on the most recent Mortgage that was taken out on this home.
Original Mortgage
$56,500
Outstanding Balance
$49,381
Interest Rate
4.7%
Mortgage Type
Purchase Money Mortgage
Estimated Equity
$112,718
Purchase Details
Closed on
May 16, 2006
Sold by
Pierce Linda M and Weaver Pamela Sue Schnurr
Bought by
Eight Five Properties
Home Financials for this Owner
Home Financials are based on the most recent Mortgage that was taken out on this home.
Original Mortgage
$64,386
Interest Rate
6.5%
Mortgage Type
Purchase Money Mortgage
Purchase Details
Closed on
Aug 10, 2005
Sold by
Gerge Ruby L
Bought by
Geroge Ruby L and Pierce Linda M
Create a Home Valuation Report for This Property
The Home Valuation Report is an in-depth analysis detailing your home's value as well as a comparison with similar homes in the area
Home Values in the Area
Average Home Value in this Area
Purchase History
| Date | Buyer | Sale Price | Title Company |
|---|---|---|---|
| Ltc 4M Llc | -- | Twin City Title | |
| Eight Five Properties | -- | None Available | |
| Geroge Ruby L | -- | None Available |
Source: Public Records
Mortgage History
| Date | Status | Borrower | Loan Amount |
|---|---|---|---|
| Open | Ltc 4M Llc | $56,500 | |
| Previous Owner | Eight Five Properties | $64,386 |
Source: Public Records
Tax History Compared to Growth
Tax History
| Year | Tax Paid | Tax Assessment Tax Assessment Total Assessment is a certain percentage of the fair market value that is determined by local assessors to be the total taxable value of land and additions on the property. | Land | Improvement |
|---|---|---|---|---|
| 2025 | $2,926 | $126,703 | $20,000 | $106,703 |
| 2024 | $2,926 | $123,594 | $20,000 | $103,594 |
| 2023 | $2,788 | $117,725 | $20,000 | $97,725 |
| 2022 | $2,205 | $92,361 | $10,000 | $82,361 |
| 2021 | $2,028 | $79,323 | $10,000 | $69,323 |
| 2020 | $1,954 | $76,023 | $10,000 | $66,023 |
| 2019 | $1,944 | $72,876 | $10,000 | $62,876 |
| 2018 | $1,879 | $70,457 | $10,000 | $60,457 |
| 2017 | $1,843 | $69,273 | $10,000 | $59,273 |
| 2016 | $1,769 | $66,487 | $10,000 | $56,487 |
| 2015 | $1,692 | $65,929 | $10,000 | $55,929 |
| 2014 | $1,692 | $65,382 | $10,000 | $55,382 |
Source: Public Records
Map
Nearby Homes