Estimated Value: $572,000 - $719,770
2
Beds
3
Baths
1,599
Sq Ft
$421/Sq Ft
Est. Value
About This Home
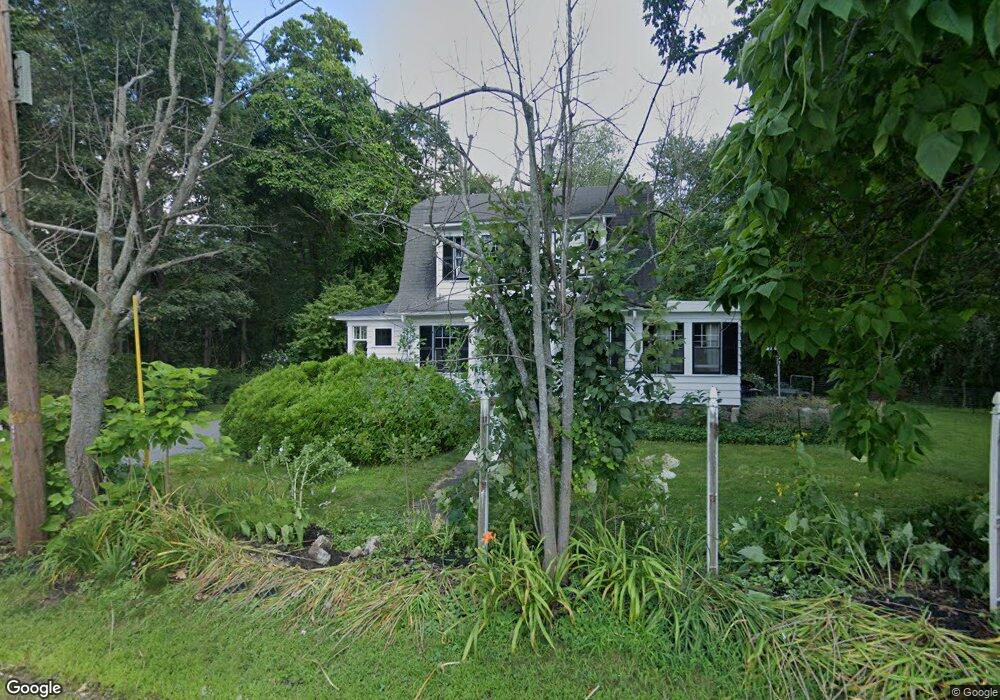
This home is located at 21 Main St, Acton, MA 01720 and is currently estimated at $672,693, approximately $420 per square foot. 21 Main St is a home located in Middlesex County with nearby schools including Acton-Boxborough Regional High School, Maynard Knowledge Beginnings, and The Imago School.
Ownership History
Date
Name
Owned For
Owner Type
Purchase Details
Closed on
Jul 5, 2007
Sold by
James David M and Martin Karen A
Bought by
James David M and Martin Karen A
Current Estimated Value
Purchase Details
Closed on
Nov 25, 1996
Sold by
Stuart Roseman
Bought by
James David M and Martin Karen A
Home Financials for this Owner
Home Financials are based on the most recent Mortgage that was taken out on this home.
Original Mortgage
$132,300
Interest Rate
7.81%
Mortgage Type
Purchase Money Mortgage
Create a Home Valuation Report for This Property
The Home Valuation Report is an in-depth analysis detailing your home's value as well as a comparison with similar homes in the area
Home Values in the Area
Average Home Value in this Area
Purchase History
| Date | Buyer | Sale Price | Title Company |
|---|---|---|---|
| James David M | -- | -- | |
| James David M | $147,000 | -- |
Source: Public Records
Mortgage History
| Date | Status | Borrower | Loan Amount |
|---|---|---|---|
| Previous Owner | James David M | $130,500 | |
| Previous Owner | James David M | $132,300 |
Source: Public Records
Tax History
| Year | Tax Paid | Tax Assessment Tax Assessment Total Assessment is a certain percentage of the fair market value that is determined by local assessors to be the total taxable value of land and additions on the property. | Land | Improvement |
|---|---|---|---|---|
| 2025 | $11,319 | $660,000 | $272,800 | $387,200 |
| 2024 | $10,594 | $635,500 | $272,800 | $362,700 |
| 2023 | $10,325 | $588,000 | $247,900 | $340,100 |
| 2022 | $9,793 | $503,500 | $216,100 | $287,400 |
| 2021 | $9,553 | $472,200 | $199,900 | $272,300 |
| 2020 | $7,484 | $389,000 | $199,900 | $189,100 |
| 2019 | $6,671 | $344,400 | $199,900 | $144,500 |
| 2018 | $6,587 | $339,900 | $199,900 | $140,000 |
| 2017 | $6,437 | $337,700 | $199,900 | $137,800 |
| 2016 | $6,363 | $330,900 | $199,900 | $131,000 |
| 2015 | $6,064 | $318,300 | $189,600 | $128,700 |
| 2014 | $5,950 | $305,900 | $189,600 | $116,300 |
Source: Public Records
Map
Nearby Homes
- 63 Conant St
- 36 Brown St
- 40 High St
- 30 Brewster Ln
- 12 Brown St
- 1 Carlton Dr
- 131 Main St
- 129 Main St Unit 129
- 70 River St
- 1 Vanderbelt Rd
- 25 Nylander Way
- 70 Powder Mill Rd
- 68 Powder Mill Rd
- 6 Beacon Ct
- 1 Drummer Rd Unit A5
- 6 Nancy Cir
- 130 Parker St Unit J2
- 2 Wall Ct
- 153 Summer St
- 31 Drummer Rd Unit 31
Your Personal Tour Guide
Ask me questions while you tour the home.