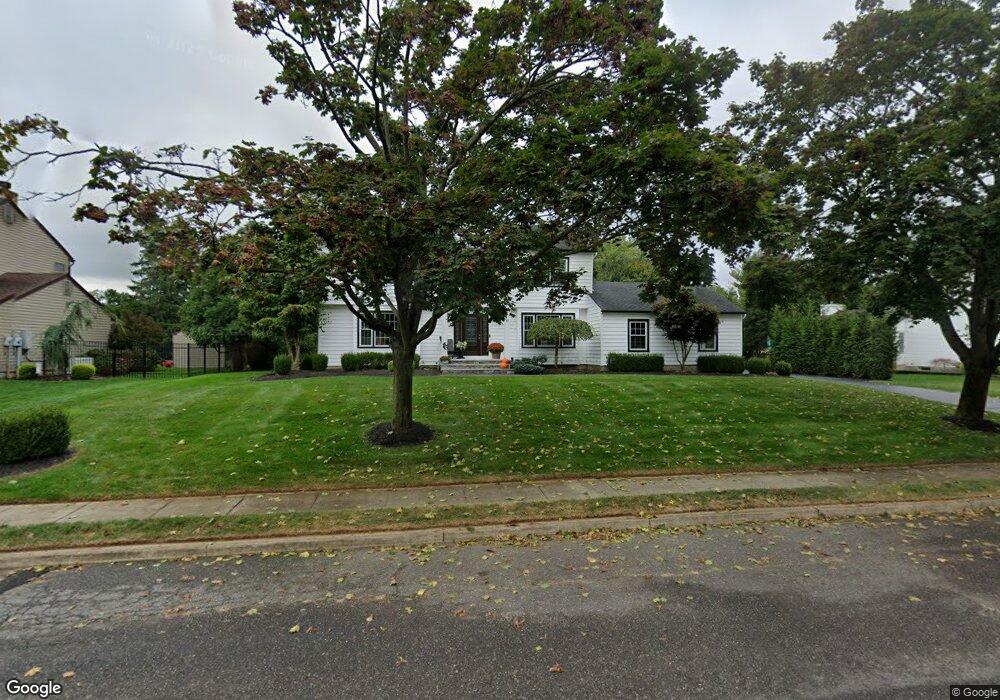
21 Manny Way Red Bank, NJ 07701
New Monmouth NeighborhoodEstimated Value: $1,143,000 - $1,215,000
4
Beds
3
Baths
2,430
Sq Ft
$488/Sq Ft
Est. Value
About This Home
This home is located at 21 Manny Way, Red Bank, NJ 07701 and is currently estimated at $1,185,756, approximately $487 per square foot. 21 Manny Way is a home located in Monmouth County with nearby schools including Nut Swamp Elementary School, Thompson Middle School, and Middletown - South High School.
Ownership History
Date
Name
Owned For
Owner Type
Purchase Details
Closed on
Jul 24, 1996
Sold by
Foti James
Bought by
Clifton William and Kathleenn Clifton
Current Estimated Value
Home Financials for this Owner
Home Financials are based on the most recent Mortgage that was taken out on this home.
Original Mortgage
$200,000
Outstanding Balance
$14,627
Interest Rate
8.37%
Estimated Equity
$1,171,129
Create a Home Valuation Report for This Property
The Home Valuation Report is an in-depth analysis detailing your home's value as well as a comparison with similar homes in the area
Home Values in the Area
Average Home Value in this Area
Purchase History
| Date | Buyer | Sale Price | Title Company |
|---|---|---|---|
| Clifton William | $340,900 | -- |
Source: Public Records
Mortgage History
| Date | Status | Borrower | Loan Amount |
|---|---|---|---|
| Open | Clifton William | $200,000 |
Source: Public Records
Tax History Compared to Growth
Tax History
| Year | Tax Paid | Tax Assessment Tax Assessment Total Assessment is a certain percentage of the fair market value that is determined by local assessors to be the total taxable value of land and additions on the property. | Land | Improvement |
|---|---|---|---|---|
| 2025 | $15,172 | $1,120,100 | $535,200 | $584,900 |
| 2024 | $15,107 | $922,300 | $348,100 | $574,200 |
| 2023 | $15,107 | $869,200 | $338,200 | $531,000 |
| 2022 | $14,568 | $774,700 | $263,300 | $511,400 |
| 2021 | $14,568 | $700,400 | $245,500 | $454,900 |
| 2020 | $15,058 | $704,300 | $254,700 | $449,600 |
| 2019 | $13,709 | $649,100 | $254,700 | $394,400 |
| 2018 | $13,773 | $635,600 | $254,700 | $380,900 |
| 2017 | $12,918 | $608,200 | $239,000 | $369,200 |
| 2016 | $12,622 | $592,300 | $264,000 | $328,300 |
| 2015 | $12,583 | $589,100 | $244,000 | $345,100 |
| 2014 | $12,026 | $549,400 | $234,000 | $315,400 |
Source: Public Records
Map
Nearby Homes
- 17 Terry Ln
- 7 Boxwood Terrace Unit 250
- 50 Hancock Ct Unit 129B
- 11 Mayflower Dr
- 911 Middletown Lincroft Rd
- 60 Falmouth Ct
- 109 Lexington Ct
- 59 Boxwood Terrace
- 143 Lexington Ct
- 83 Green Meadow Blvd
- 163 Lexington Ct
- 164 Arrowwood Ct
- 40 Ellsworth Ct
- 12 Ellsworth Ct
- 7 Lexington Ct
- 32 Ellsworth Ct
- 25 Claremont Ct
- 60 Privet Place
- 19 Manchester Ct
- 11 Manchester Ct