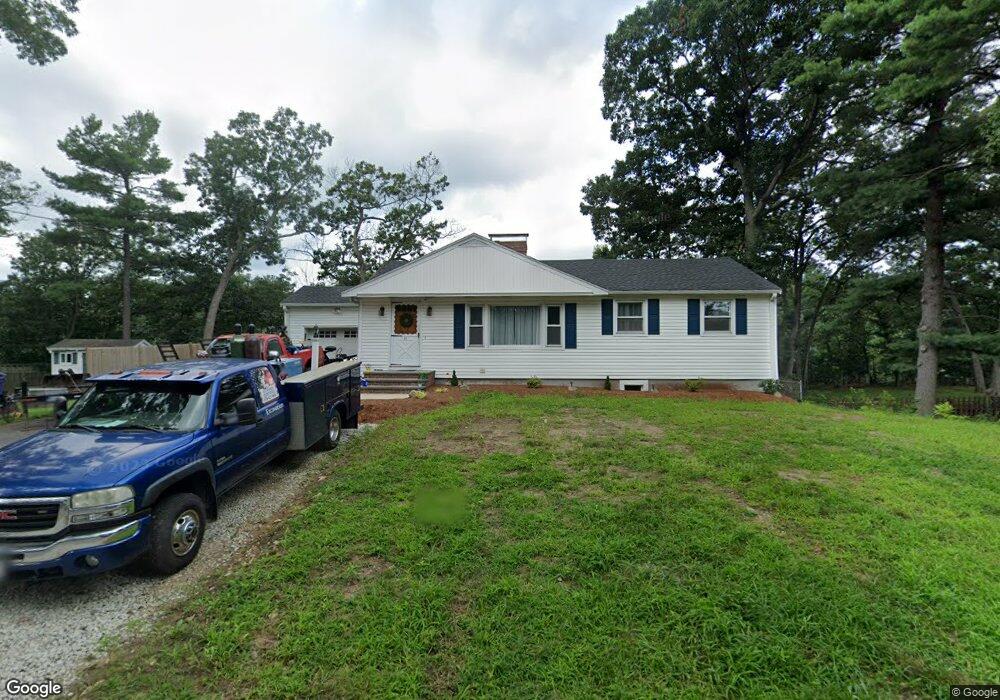
21 Marcus Rd Wilmington, MA 01887
Estimated Value: $548,000 - $684,254
2
Beds
3
Baths
1,008
Sq Ft
$615/Sq Ft
Est. Value
About This Home
This home is located at 21 Marcus Rd, Wilmington, MA 01887 and is currently estimated at $620,064, approximately $615 per square foot. 21 Marcus Rd is a home located in Middlesex County with nearby schools including Wilmington Middle School and Wilmington High School.
Ownership History
Date
Name
Owned For
Owner Type
Purchase Details
Closed on
Oct 25, 2019
Sold by
Newhouse Ralph
Bought by
Newhouse Ralph
Current Estimated Value
Home Financials for this Owner
Home Financials are based on the most recent Mortgage that was taken out on this home.
Original Mortgage
$247,500
Outstanding Balance
$215,362
Interest Rate
3.6%
Mortgage Type
New Conventional
Estimated Equity
$404,702
Purchase Details
Closed on
Feb 20, 2018
Sold by
Golden Rt and Goldberg
Bought by
Newhouse 3Rd Ralph and Newhouse Shelly
Home Financials for this Owner
Home Financials are based on the most recent Mortgage that was taken out on this home.
Original Mortgage
$247,000
Interest Rate
3.95%
Mortgage Type
New Conventional
Purchase Details
Closed on
Oct 24, 2017
Sold by
Edna M Ferguson Irt and Ferguson
Bought by
Golden Rt and Goldberg
Purchase Details
Closed on
Aug 15, 2007
Sold by
Roger M M and Roger Edna M
Bought by
Edna M Ferguson Irt and Ferguson
Create a Home Valuation Report for This Property
The Home Valuation Report is an in-depth analysis detailing your home's value as well as a comparison with similar homes in the area
Purchase History
| Date | Buyer | Sale Price | Title Company |
|---|---|---|---|
| Newhouse Ralph | -- | -- | |
| Newhouse 3Rd Ralph | $260,000 | -- | |
| Golden Rt | $260,000 | -- | |
| Edna M Ferguson Irt | -- | -- | |
| Edna M Ferguson Irt | -- | -- |
Source: Public Records
Mortgage History
| Date | Status | Borrower | Loan Amount |
|---|---|---|---|
| Open | Newhouse Ralph | $247,500 | |
| Previous Owner | Newhouse 3Rd Ralph | $247,000 | |
| Previous Owner | Edna M Ferguson Irt | $311,000 |
Source: Public Records
Tax History
| Year | Tax Paid | Tax Assessment Tax Assessment Total Assessment is a certain percentage of the fair market value that is determined by local assessors to be the total taxable value of land and additions on the property. | Land | Improvement |
|---|---|---|---|---|
| 2025 | $6,541 | $571,300 | $285,500 | $285,800 |
| 2024 | $6,278 | $549,300 | $285,500 | $263,800 |
| 2023 | $6,094 | $510,400 | $259,500 | $250,900 |
| 2022 | $5,801 | $445,200 | $216,300 | $228,900 |
| 2021 | $5,821 | $420,600 | $196,600 | $224,000 |
| 2020 | $5,564 | $409,700 | $196,600 | $213,100 |
| 2019 | $5,330 | $387,600 | $187,200 | $200,400 |
| 2018 | $4,856 | $337,000 | $178,300 | $158,700 |
| 2017 | $4,601 | $318,400 | $171,000 | $147,400 |
| 2016 | $4,408 | $301,300 | $162,900 | $138,400 |
| 2015 | $4,080 | $283,900 | $162,900 | $121,000 |
| 2014 | $3,943 | $276,900 | $155,100 | $121,800 |
Source: Public Records
Map
Nearby Homes
- 41 Marcus Rd
- 21 Marcia Rd
- 17 Carson Ave
- 10 Pilling Rd
- 9 Marie Dr
- 15 Mystic Ave
- 12 Hamlin Ln
- 280 Martins Landing Unit 312
- 220 Martins Landing Unit 309
- 260 Martins Landing Unit 508
- 200 Martins Landing Unit 102
- 250 Martins Landing Unit 402
- 320 Martins Landing Unit 401
- 320 Martins Landing Unit 2410
- 320 Martins Landing Unit 502
- 320 Martins Landing Unit 102
- 320 Martins Landing Unit 107
- 320 Martins Landing Unit 404
- 320 Martins Landing Unit 209
- 28 Nutter Rd
Your Personal Tour Guide
Ask me questions while you tour the home.