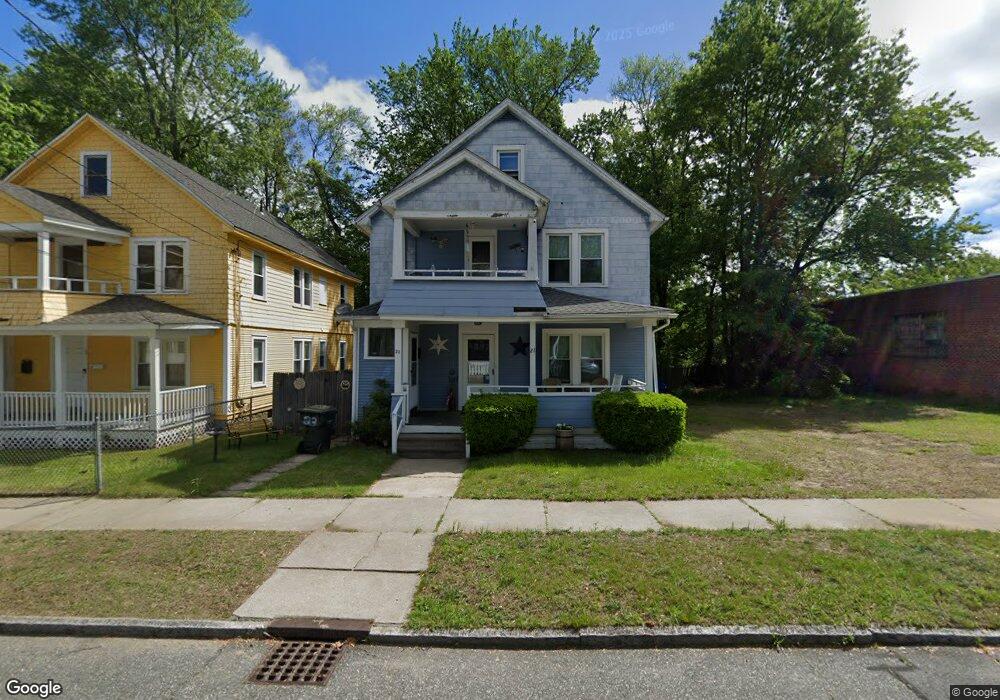
21 Margerie St Unit 23 Springfield, MA 01109
Pine Point NeighborhoodEstimated Value: $317,383 - $351,000
6
Beds
2
Baths
2,246
Sq Ft
$151/Sq Ft
Est. Value
About This Home
This home is located at 21 Margerie St Unit 23, Springfield, MA 01109 and is currently estimated at $339,596, approximately $151 per square foot. 21 Margerie St Unit 23 is a home located in Hampden County with nearby schools including John F. Kennedy Academy, Roger L. Putnam Vocational Technical Academy, and Springfield Central High School.
Ownership History
Date
Name
Owned For
Owner Type
Purchase Details
Closed on
Dec 1, 1994
Sold by
Chicopee Sb
Bought by
Wildes David M
Current Estimated Value
Home Financials for this Owner
Home Financials are based on the most recent Mortgage that was taken out on this home.
Original Mortgage
$50,919
Interest Rate
8.81%
Mortgage Type
Purchase Money Mortgage
Purchase Details
Closed on
Mar 5, 1992
Sold by
Levester Nelvin A and Levester June A
Bought by
Chicopee Sb
Create a Home Valuation Report for This Property
The Home Valuation Report is an in-depth analysis detailing your home's value as well as a comparison with similar homes in the area
Home Values in the Area
Average Home Value in this Area
Purchase History
| Date | Buyer | Sale Price | Title Company |
|---|---|---|---|
| Wildes David M | $51,000 | -- | |
| Chicopee Sb | $94,869 | -- |
Source: Public Records
Mortgage History
| Date | Status | Borrower | Loan Amount |
|---|---|---|---|
| Open | Chicopee Sb | $73,000 | |
| Closed | Chicopee Sb | $52,500 | |
| Closed | Chicopee Sb | $50,919 |
Source: Public Records
Tax History Compared to Growth
Tax History
| Year | Tax Paid | Tax Assessment Tax Assessment Total Assessment is a certain percentage of the fair market value that is determined by local assessors to be the total taxable value of land and additions on the property. | Land | Improvement |
|---|---|---|---|---|
| 2025 | $4,063 | $259,100 | $36,600 | $222,500 |
| 2024 | $3,747 | $233,300 | $30,500 | $202,800 |
| 2023 | $3,787 | $222,100 | $27,700 | $194,400 |
| 2022 | $3,100 | $164,700 | $25,900 | $138,800 |
| 2021 | $2,945 | $155,800 | $23,500 | $132,300 |
| 2020 | $2,719 | $139,200 | $23,500 | $115,700 |
| 2019 | $2,700 | $137,200 | $23,500 | $113,700 |
| 2018 | $2,596 | $131,900 | $23,500 | $108,400 |
| 2017 | $2,562 | $130,300 | $21,800 | $108,500 |
| 2016 | $2,334 | $118,700 | $21,800 | $96,900 |
| 2015 | $2,240 | $113,900 | $21,800 | $92,100 |
Source: Public Records
Map
Nearby Homes