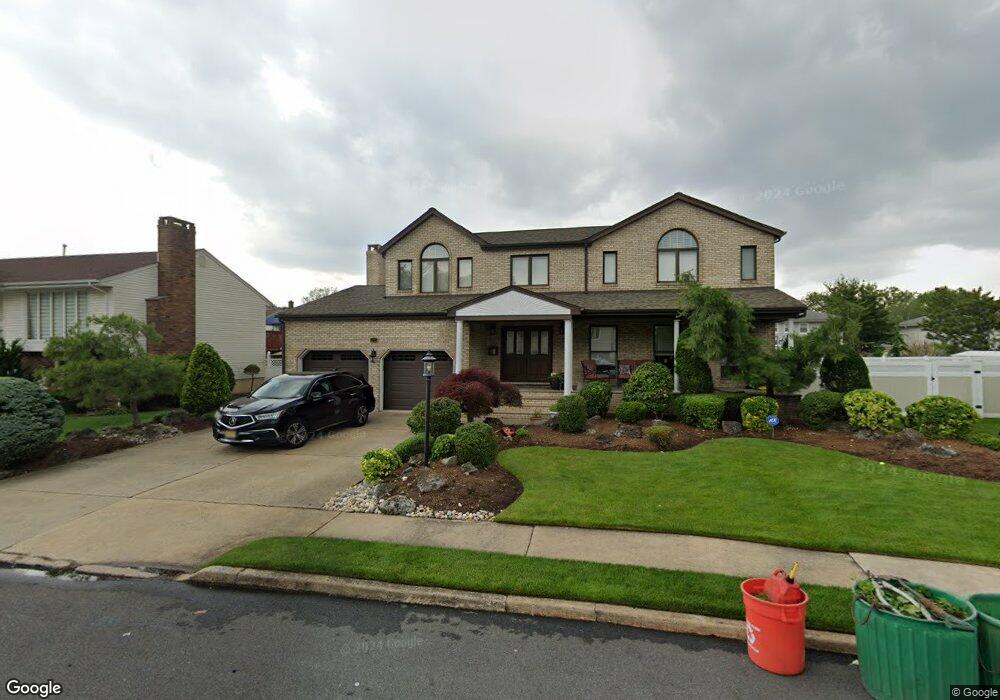
21 Mariani Dr Little Ferry, NJ 07643
Estimated Value: $866,525 - $1,002,000
--
Bed
--
Bath
2,848
Sq Ft
$338/Sq Ft
Est. Value
About This Home
This home is located at 21 Mariani Dr, Little Ferry, NJ 07643 and is currently estimated at $963,881, approximately $338 per square foot. 21 Mariani Dr is a home located in Bergen County with nearby schools including Memorial Middle School and George Washington School.
Ownership History
Date
Name
Owned For
Owner Type
Purchase Details
Closed on
Mar 5, 2014
Sold by
Buonsanto Marta and Pestrichella Marta
Bought by
Palmadessa David and Palmadessa Arlene
Current Estimated Value
Home Financials for this Owner
Home Financials are based on the most recent Mortgage that was taken out on this home.
Original Mortgage
$350,000
Outstanding Balance
$264,378
Interest Rate
4.25%
Mortgage Type
New Conventional
Estimated Equity
$699,503
Purchase Details
Closed on
Dec 6, 2010
Sold by
Pestrichella Marta and Pestrichella Bartolomeo
Bought by
Buonsanto Marta and Pestrichella Marta
Create a Home Valuation Report for This Property
The Home Valuation Report is an in-depth analysis detailing your home's value as well as a comparison with similar homes in the area
Home Values in the Area
Average Home Value in this Area
Purchase History
| Date | Buyer | Sale Price | Title Company |
|---|---|---|---|
| Palmadessa David | $499,000 | -- | |
| Buonsanto Marta | -- | -- |
Source: Public Records
Mortgage History
| Date | Status | Borrower | Loan Amount |
|---|---|---|---|
| Open | Palmadessa David | $350,000 |
Source: Public Records
Tax History Compared to Growth
Tax History
| Year | Tax Paid | Tax Assessment Tax Assessment Total Assessment is a certain percentage of the fair market value that is determined by local assessors to be the total taxable value of land and additions on the property. | Land | Improvement |
|---|---|---|---|---|
| 2025 | $16,651 | $703,900 | $283,900 | $420,000 |
| 2024 | $16,617 | $664,700 | $251,400 | $413,300 |
| 2023 | $16,443 | $604,900 | $218,900 | $386,000 |
| 2022 | $16,443 | $558,700 | $196,400 | $362,300 |
| 2021 | $16,069 | $517,500 | $181,400 | $336,100 |
| 2020 | $16,444 | $506,900 | $178,900 | $328,000 |
| 2019 | $16,248 | $498,400 | $176,400 | $322,000 |
| 2018 | $16,238 | $491,900 | $173,900 | $318,000 |
| 2017 | $16,150 | $483,400 | $171,400 | $312,000 |
| 2016 | $16,016 | $477,800 | $168,900 | $308,900 |
| 2015 | $16,601 | $495,700 | $163,900 | $331,800 |
| 2014 | $14,203 | $539,000 | $264,300 | $274,700 |
Source: Public Records
Map
Nearby Homes
- 135 Franklin St
- 113 Franklin St
- 169 Franklin St
- 95 Redneck Ave
- 93 Redneck Ave
- 23 Robby Rd
- 103 Niehaus Ave
- 16 Elizabeth Ct
- 28 Niehaus Ave
- 80 Union Ave
- 26 Christina St
- 85 Grove St
- 180 Main St
- 12 Brandt St
- 70 Christina St
- 23 Grand St
- 89 Liberty St
- 46 Grand St
- 453 Liberty St Unit 14
- 17 Chamberlain Ave Unit B