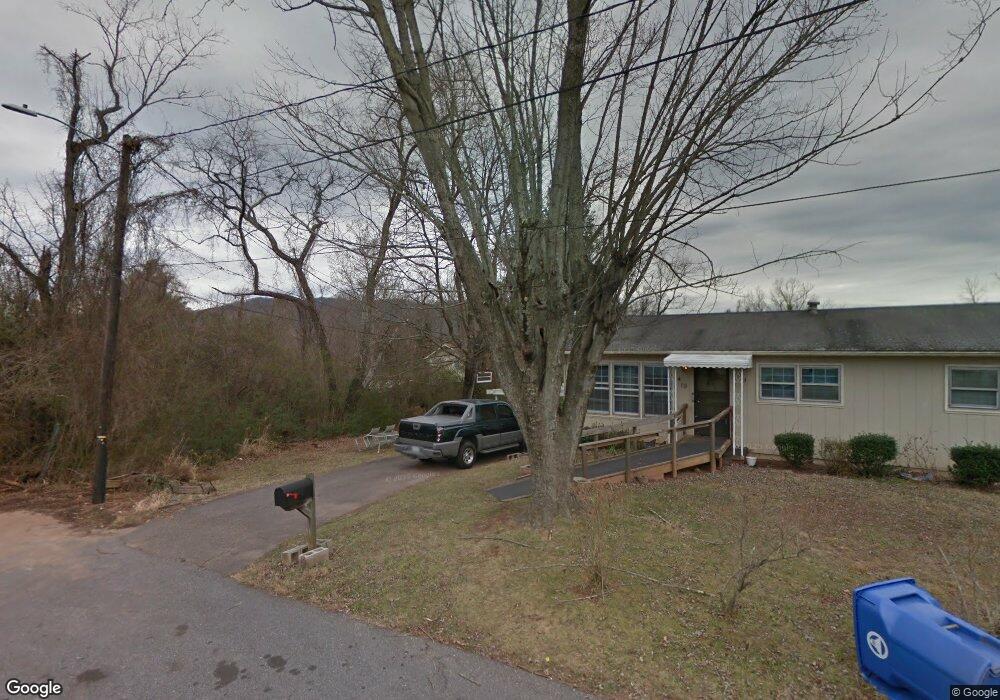
21 Marigold St Asheville, NC 28803
Estimated Value: $360,191 - $452,000
3
Beds
2
Baths
1,728
Sq Ft
$238/Sq Ft
Est. Value
About This Home
This home is located at 21 Marigold St, Asheville, NC 28803 and is currently estimated at $411,798, approximately $238 per square foot. 21 Marigold St is a home located in Buncombe County with nearby schools including T.C. Roberson High School, William W. Estes Elementary School, and Koontz Intermediate School.
Ownership History
Date
Name
Owned For
Owner Type
Purchase Details
Closed on
Dec 12, 2024
Sold by
Perkins Margaret M and Perkins Horatio
Bought by
Perkins Horatio and Perkins Margaret M
Current Estimated Value
Home Financials for this Owner
Home Financials are based on the most recent Mortgage that was taken out on this home.
Original Mortgage
$363,800
Outstanding Balance
$360,900
Interest Rate
6.72%
Mortgage Type
VA
Estimated Equity
$50,898
Purchase Details
Closed on
Feb 9, 2022
Sold by
Edney Mcmillan Wanda
Bought by
Perkins Margaret M
Home Financials for this Owner
Home Financials are based on the most recent Mortgage that was taken out on this home.
Original Mortgage
$247,000
Interest Rate
3.56%
Mortgage Type
VA
Create a Home Valuation Report for This Property
The Home Valuation Report is an in-depth analysis detailing your home's value as well as a comparison with similar homes in the area
Home Values in the Area
Average Home Value in this Area
Purchase History
| Date | Buyer | Sale Price | Title Company |
|---|---|---|---|
| Perkins Horatio | -- | Vantage Point Title | |
| Perkins Horatio | -- | Vantage Point Title | |
| Perkins Margaret M | $494 | Reed Law Firm Pc |
Source: Public Records
Mortgage History
| Date | Status | Borrower | Loan Amount |
|---|---|---|---|
| Open | Perkins Horatio | $363,800 | |
| Closed | Perkins Horatio | $363,800 | |
| Previous Owner | Perkins Margaret M | $247,000 |
Source: Public Records
Tax History Compared to Growth
Tax History
| Year | Tax Paid | Tax Assessment Tax Assessment Total Assessment is a certain percentage of the fair market value that is determined by local assessors to be the total taxable value of land and additions on the property. | Land | Improvement |
|---|---|---|---|---|
| 2025 | $2,382 | $257,000 | $61,300 | $195,700 |
| 2024 | $2,382 | $257,000 | $61,300 | $195,700 |
| 2023 | $2,382 | $257,000 | $61,300 | $195,700 |
| 2022 | $2,290 | $257,000 | $0 | $0 |
| 2021 | $2,290 | $257,000 | $0 | $0 |
| 2020 | $1,732 | $180,800 | $0 | $0 |
| 2019 | $1,732 | $180,800 | $0 | $0 |
| 2018 | $1,732 | $180,800 | $0 | $0 |
| 2017 | $1,750 | $149,100 | $0 | $0 |
| 2016 | $1,609 | $149,100 | $0 | $0 |
| 2015 | $1,609 | $149,100 | $0 | $0 |
| 2014 | $1,586 | $149,100 | $0 | $0 |
Source: Public Records
Map
Nearby Homes
- 31 White Ave
- 19 White Ave
- 17 White Ave
- 60 Shiloh Rd
- 979 W Chapel Rd
- 970 W Chapel Rd
- 917 W Chapel Rd
- 7 Chapel Park Place
- 99999 Taft Ave
- 720 Reed St
- 711 Reed St
- 332 Appeldoorn Cir
- 30 Fern St
- 358 London Rd
- 7 Wilson Creek Dr
- 726 Appeldoorn Cir Unit 726
- 352 London Rd
- 0000 Booker St
- TBA Booker St Unit 9 & 10
- 617 Appeldoorn Cir Unit 617