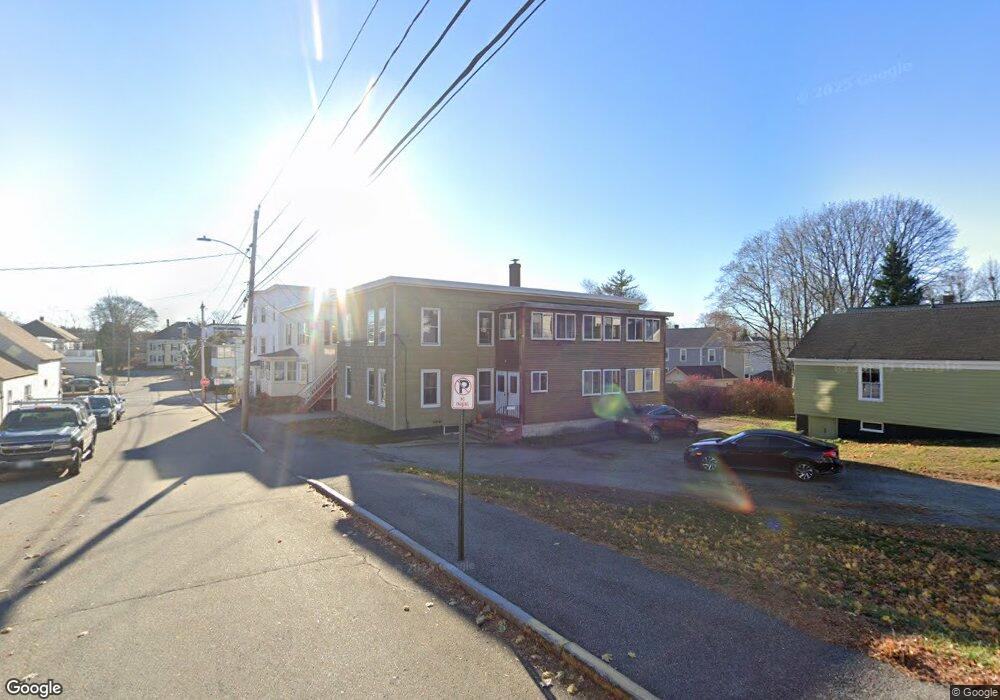
21 Mason St Biddeford, ME 04005
Estimated Value: $447,954 - $546,000
5
Beds
2
Baths
2,480
Sq Ft
$201/Sq Ft
Est. Value
About This Home
This home is located at 21 Mason St, Biddeford, ME 04005 and is currently estimated at $498,239, approximately $200 per square foot. 21 Mason St is a home located in York County with nearby schools including John F Kennedy Memorial School, Biddeford Primary School, and Biddeford Intermediate School.
Ownership History
Date
Name
Owned For
Owner Type
Purchase Details
Closed on
Mar 30, 2023
Sold by
Montpas Robert R Est and Montpas
Bought by
Montpas Robyn R
Current Estimated Value
Home Financials for this Owner
Home Financials are based on the most recent Mortgage that was taken out on this home.
Original Mortgage
$96,000
Outstanding Balance
$92,663
Interest Rate
6.32%
Mortgage Type
Purchase Money Mortgage
Estimated Equity
$405,576
Create a Home Valuation Report for This Property
The Home Valuation Report is an in-depth analysis detailing your home's value as well as a comparison with similar homes in the area
Home Values in the Area
Average Home Value in this Area
Purchase History
| Date | Buyer | Sale Price | Title Company |
|---|---|---|---|
| Montpas Robyn R | $120,000 | None Available |
Source: Public Records
Mortgage History
| Date | Status | Borrower | Loan Amount |
|---|---|---|---|
| Open | Montpas Robyn R | $96,000 |
Source: Public Records
Tax History
| Year | Tax Paid | Tax Assessment Tax Assessment Total Assessment is a certain percentage of the fair market value that is determined by local assessors to be the total taxable value of land and additions on the property. | Land | Improvement |
|---|---|---|---|---|
| 2025 | $5,127 | $343,200 | $134,300 | $208,900 |
| 2024 | $4,826 | $339,400 | $134,300 | $205,100 |
| 2023 | $4,414 | $336,400 | $134,300 | $202,100 |
| 2022 | $3,728 | $227,200 | $73,600 | $153,600 |
| 2021 | $3,557 | $195,100 | $61,300 | $133,800 |
| 2020 | $3,332 | $166,200 | $52,100 | $114,100 |
| 2019 | $3,321 | $166,200 | $52,100 | $114,100 |
| 2018 | $3,274 | $166,200 | $52,100 | $114,100 |
| 2017 | $3,245 | $161,700 | $52,100 | $109,600 |
| 2016 | $3,211 | $161,700 | $52,100 | $109,600 |
| 2015 | $2,954 | $161,700 | $52,100 | $109,600 |
| 2014 | $2,881 | $161,700 | $52,100 | $109,600 |
| 2013 | -- | $183,800 | $66,100 | $117,700 |
Source: Public Records
Map
Nearby Homes
Your Personal Tour Guide
Ask me questions while you tour the home.