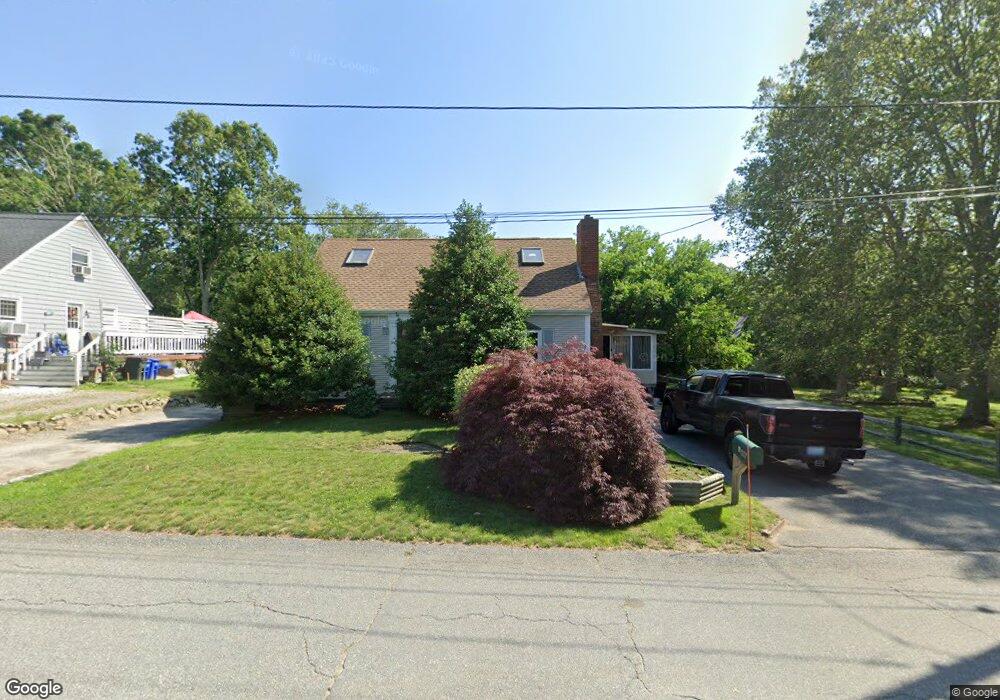
21 Massey Rd Tiverton, RI 02878
North Tiverton NeighborhoodEstimated Value: $440,697 - $520,000
2
Beds
1
Bath
1,386
Sq Ft
$348/Sq Ft
Est. Value
About This Home
This home is located at 21 Massey Rd, Tiverton, RI 02878 and is currently estimated at $481,674, approximately $347 per square foot. 21 Massey Rd is a home located in Newport County with nearby schools including Tiverton High School, Argosy Collegiate Charter School, and Saint Stanislaus School.
Ownership History
Date
Name
Owned For
Owner Type
Purchase Details
Closed on
Mar 8, 2022
Sold by
Oliver Barry and Halpen Fernanda M
Bought by
Halpen Edward N
Current Estimated Value
Home Financials for this Owner
Home Financials are based on the most recent Mortgage that was taken out on this home.
Original Mortgage
$156,000
Outstanding Balance
$145,754
Interest Rate
3.92%
Mortgage Type
Purchase Money Mortgage
Estimated Equity
$335,920
Purchase Details
Closed on
Sep 20, 2021
Sold by
Halpen Fernanda M
Bought by
Oliver Barry and Halpen Fernanda M
Purchase Details
Closed on
Nov 13, 1991
Sold by
Halpen Rose Anna
Bought by
Halpen Edward
Create a Home Valuation Report for This Property
The Home Valuation Report is an in-depth analysis detailing your home's value as well as a comparison with similar homes in the area
Home Values in the Area
Average Home Value in this Area
Purchase History
| Date | Buyer | Sale Price | Title Company |
|---|---|---|---|
| Halpen Edward N | $195,000 | None Available | |
| Oliver Barry | -- | None Available | |
| Halpen Fernanda M | -- | None Available | |
| Halpen Edward | $115,000 | -- |
Source: Public Records
Mortgage History
| Date | Status | Borrower | Loan Amount |
|---|---|---|---|
| Open | Halpen Edward N | $156,000 |
Source: Public Records
Tax History Compared to Growth
Tax History
| Year | Tax Paid | Tax Assessment Tax Assessment Total Assessment is a certain percentage of the fair market value that is determined by local assessors to be the total taxable value of land and additions on the property. | Land | Improvement |
|---|---|---|---|---|
| 2025 | $4,118 | $372,700 | $111,200 | $261,500 |
| 2024 | $4,118 | $372,700 | $111,200 | $261,500 |
| 2023 | $4,004 | $268,700 | $104,100 | $164,600 |
| 2022 | $3,931 | $268,700 | $104,100 | $164,600 |
| 2021 | $3,834 | $268,700 | $104,100 | $164,600 |
| 2020 | $4,044 | $249,800 | $76,400 | $173,400 |
| 2019 | $3,944 | $249,800 | $76,400 | $173,400 |
| 2018 | $4,094 | $249,800 | $76,400 | $173,400 |
| 2017 | $4,214 | $221,200 | $73,900 | $147,300 |
| 2016 | $4,234 | $221,200 | $73,900 | $147,300 |
| 2015 | $4,234 | $221,200 | $73,900 | $147,300 |
| 2014 | $3,897 | $201,900 | $71,000 | $130,900 |
Source: Public Records
Map
Nearby Homes