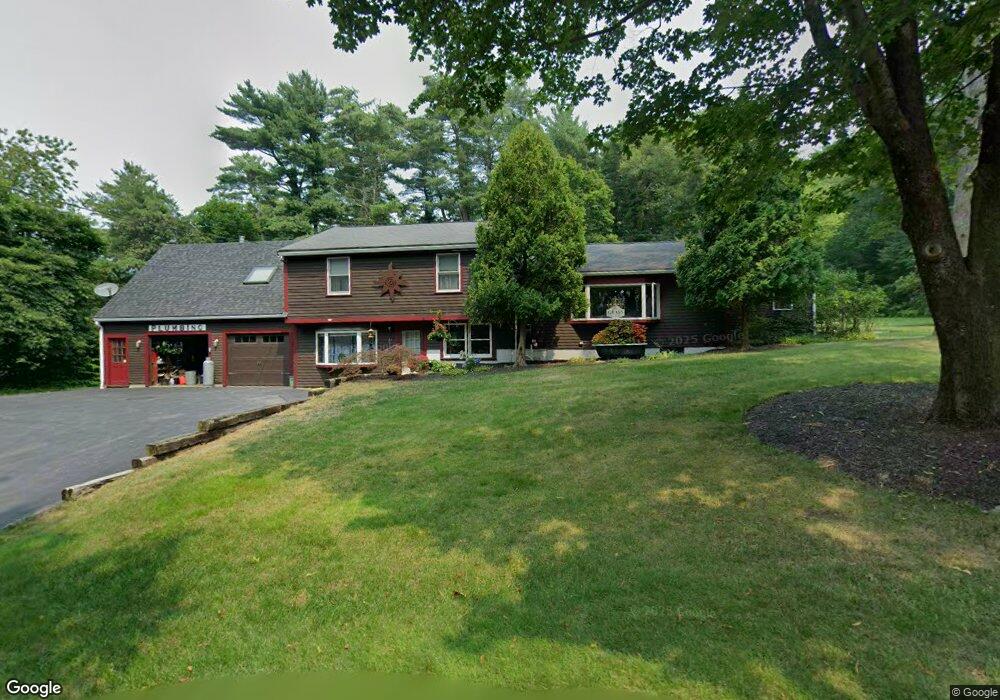
21 Mather Rd Marshfield, MA 02050
Estimated Value: $816,000 - $912,000
4
Beds
2
Baths
1,848
Sq Ft
$468/Sq Ft
Est. Value
About This Home
This home is located at 21 Mather Rd, Marshfield, MA 02050 and is currently estimated at $865,597, approximately $468 per square foot. 21 Mather Rd is a home located in Plymouth County with nearby schools including South River, Furnace Brook Middle School, and Marshfield High School.
Ownership History
Date
Name
Owned For
Owner Type
Purchase Details
Closed on
Dec 7, 2021
Sold by
Gray Peter R and Gray Marybeth
Bought by
Peter R Gray T R and Peter Gray
Current Estimated Value
Purchase Details
Closed on
Jul 30, 2003
Sold by
Gray Beatrice L and Gray Peter R
Bought by
Gray Peter A and Gray Marybeth
Home Financials for this Owner
Home Financials are based on the most recent Mortgage that was taken out on this home.
Original Mortgage
$175,000
Interest Rate
5.28%
Mortgage Type
Purchase Money Mortgage
Create a Home Valuation Report for This Property
The Home Valuation Report is an in-depth analysis detailing your home's value as well as a comparison with similar homes in the area
Home Values in the Area
Average Home Value in this Area
Purchase History
| Date | Buyer | Sale Price | Title Company |
|---|---|---|---|
| Peter R Gray T R | -- | None Available | |
| Peter R Gray T R | -- | None Available | |
| Gray Peter A | -- | -- | |
| Gray Peter A | -- | -- |
Source: Public Records
Mortgage History
| Date | Status | Borrower | Loan Amount |
|---|---|---|---|
| Previous Owner | Gray Peter A | $183,000 | |
| Previous Owner | Gray Peter A | $175,000 |
Source: Public Records
Tax History
| Year | Tax Paid | Tax Assessment Tax Assessment Total Assessment is a certain percentage of the fair market value that is determined by local assessors to be the total taxable value of land and additions on the property. | Land | Improvement |
|---|---|---|---|---|
| 2025 | $7,153 | $722,500 | $302,900 | $419,600 |
| 2024 | $6,883 | $662,500 | $288,500 | $374,000 |
| 2023 | $6,537 | $605,400 | $267,900 | $337,500 |
| 2022 | $6,537 | $504,800 | $237,000 | $267,800 |
| 2021 | $6,174 | $468,100 | $237,000 | $231,100 |
| 2020 | $5,827 | $437,100 | $216,400 | $220,700 |
| 2019 | $5,848 | $437,100 | $216,400 | $220,700 |
| 2018 | $5,844 | $437,100 | $216,400 | $220,700 |
| 2017 | $5,552 | $404,700 | $216,400 | $188,300 |
| 2016 | $5,442 | $392,100 | $216,400 | $175,700 |
| 2015 | $5,211 | $392,100 | $216,400 | $175,700 |
| 2014 | $4,883 | $367,400 | $216,400 | $151,000 |
Source: Public Records
Map
Nearby Homes
- 86 Telegraph Hill Rd
- 10 Spyglass Landing Dr
- 16 Schooner Way
- 566 Holly Rd
- 39 High Beacon Way
- 1192 S River St
- 255 Ridge Rd
- 4 Summer St
- 3 Summer St
- 155 Quincy Ave
- 97 Wrights Way
- 14 Ferry St
- 487 Main St
- 92 Salt Meadow Waye
- 235 Main St
- 290 S River St
- 341 Furnace St
- 316 Summer St
- 1155 Main St
- 30 Chandler Dr
- 25 Kennedy Rd
- 680 Ferry St
- 690 Ferry St
- 672 Ferry St
- 700 Ferry St
- 662 Ferry St
- 675 Ferry St
- 650 Ferry St
- 41 Spyglass Landing Dr
- 39 Spyglass Landing Dr
- 37 Spyglass Landing Dr
- 37 Spyglass Landing Dr Unit 37
- 619 Holly Rd
- 35 Spyglass Landing Dr
- 33 Spyglass Landing Dr
- 31 Spyglass Landing Dr
- 31 Spyglass Landing Dr Unit 28
- 663 Ferry St
- 712 Ferry St
- 47 Spyglass Landing Dr
Your Personal Tour Guide
Ask me questions while you tour the home.