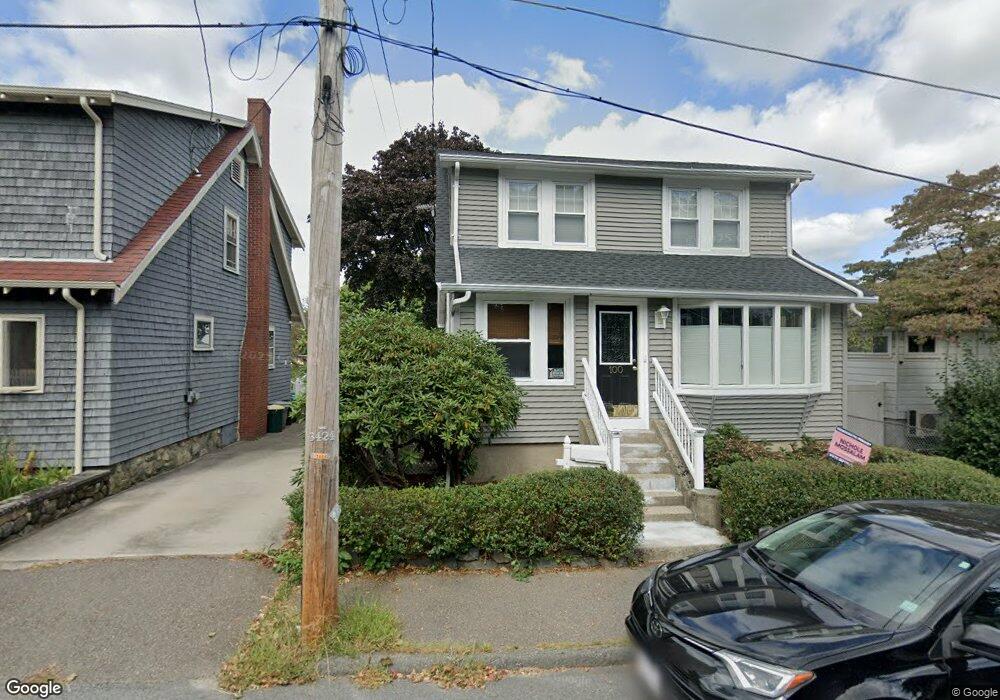
21 Mccall St Medford, MA 02155
North Medford NeighborhoodEstimated Value: $711,000 - $848,000
4
Beds
2
Baths
1,871
Sq Ft
$417/Sq Ft
Est. Value
About This Home
This home is located at 21 Mccall St, Medford, MA 02155 and is currently estimated at $780,328, approximately $417 per square foot. 21 Mccall St is a home located in Middlesex County with nearby schools including Medford High School, Mystic Valley Regional Charter School, and Greater Boston Academy.
Ownership History
Date
Name
Owned For
Owner Type
Purchase Details
Closed on
Jan 11, 1994
Sold by
Moore Charles J and Moore Diane M
Bought by
Lapaglia William F and Lapaglia Jolee A
Current Estimated Value
Create a Home Valuation Report for This Property
The Home Valuation Report is an in-depth analysis detailing your home's value as well as a comparison with similar homes in the area
Home Values in the Area
Average Home Value in this Area
Purchase History
| Date | Buyer | Sale Price | Title Company |
|---|---|---|---|
| Lapaglia William F | $123,500 | -- |
Source: Public Records
Mortgage History
| Date | Status | Borrower | Loan Amount |
|---|---|---|---|
| Open | Lapaglia William F | $220,000 | |
| Closed | Lapaglia William F | $73,000 | |
| Closed | Lapaglia William F | $38,618 |
Source: Public Records
Tax History Compared to Growth
Tax History
| Year | Tax Paid | Tax Assessment Tax Assessment Total Assessment is a certain percentage of the fair market value that is determined by local assessors to be the total taxable value of land and additions on the property. | Land | Improvement |
|---|---|---|---|---|
| 2025 | $6,328 | $719,100 | $382,400 | $336,700 |
| 2024 | $5,909 | $693,500 | $364,200 | $329,300 |
| 2023 | $5,625 | $650,300 | $340,400 | $309,900 |
| 2022 | $5,480 | $608,200 | $309,400 | $298,800 |
| 2021 | $5,299 | $563,100 | $294,700 | $268,400 |
| 2020 | $5,264 | $573,400 | $302,300 | $271,100 |
| 2019 | $5,041 | $525,100 | $274,800 | $250,300 |
| 2018 | $4,951 | $483,500 | $249,800 | $233,700 |
| 2017 | $4,827 | $457,100 | $233,400 | $223,700 |
| 2016 | $4,476 | $400,000 | $212,200 | $187,800 |
| 2015 | $4,306 | $368,000 | $202,100 | $165,900 |
Source: Public Records
Map
Nearby Homes