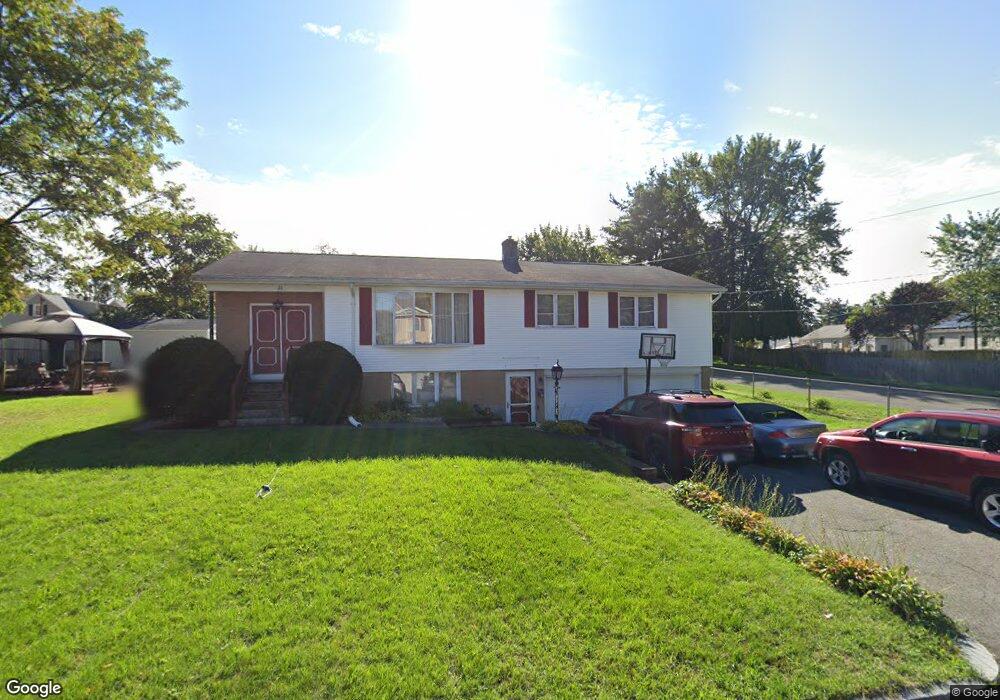
21 Mellon St Springfield, MA 01104
Liberty Heights NeighborhoodEstimated Value: $257,000 - $287,601
3
Beds
1
Bath
1,012
Sq Ft
$270/Sq Ft
Est. Value
About This Home
This home is located at 21 Mellon St, Springfield, MA 01104 and is currently estimated at $273,650, approximately $270 per square foot. 21 Mellon St is a home located in Hampden County with nearby schools including Mary O. Pottenger Elementary School, Van Sickle Academy, and High School Of Commerce.
Ownership History
Date
Name
Owned For
Owner Type
Purchase Details
Closed on
Dec 29, 2003
Sold by
Borders Julian C and Borders Lisa E
Bought by
Borders Julian C and Borders Lisa E
Current Estimated Value
Home Financials for this Owner
Home Financials are based on the most recent Mortgage that was taken out on this home.
Original Mortgage
$98,000
Outstanding Balance
$46,180
Interest Rate
6.01%
Mortgage Type
Purchase Money Mortgage
Estimated Equity
$227,470
Purchase Details
Closed on
Dec 9, 1998
Sold by
Est Thibault Adeline and Morency Jeannette
Bought by
Borders Julian C and Lawson Lisa E
Home Financials for this Owner
Home Financials are based on the most recent Mortgage that was taken out on this home.
Original Mortgage
$85,480
Interest Rate
6.8%
Mortgage Type
Purchase Money Mortgage
Create a Home Valuation Report for This Property
The Home Valuation Report is an in-depth analysis detailing your home's value as well as a comparison with similar homes in the area
Home Values in the Area
Average Home Value in this Area
Purchase History
| Date | Buyer | Sale Price | Title Company |
|---|---|---|---|
| Borders Julian C | -- | -- | |
| Borders Julian C | $88,000 | -- |
Source: Public Records
Mortgage History
| Date | Status | Borrower | Loan Amount |
|---|---|---|---|
| Open | Borders Julian C | $98,000 | |
| Previous Owner | Borders Julian C | $85,480 |
Source: Public Records
Tax History Compared to Growth
Tax History
| Year | Tax Paid | Tax Assessment Tax Assessment Total Assessment is a certain percentage of the fair market value that is determined by local assessors to be the total taxable value of land and additions on the property. | Land | Improvement |
|---|---|---|---|---|
| 2025 | $3,362 | $214,400 | $38,700 | $175,700 |
| 2024 | $2,953 | $183,900 | $38,700 | $145,200 |
| 2023 | $2,820 | $165,400 | $34,300 | $131,100 |
| 2022 | $2,893 | $153,700 | $32,000 | $121,700 |
| 2021 | $2,576 | $136,300 | $29,200 | $107,100 |
| 2020 | $2,635 | $134,900 | $29,200 | $105,700 |
| 2019 | $2,466 | $125,300 | $31,700 | $93,600 |
| 2018 | $2,334 | $118,600 | $31,700 | $86,900 |
| 2017 | $2,176 | $110,700 | $28,700 | $82,000 |
| 2016 | $2,127 | $108,200 | $27,200 | $81,000 |
| 2015 | $2,124 | $108,000 | $27,200 | $80,800 |
Source: Public Records
Map
Nearby Homes