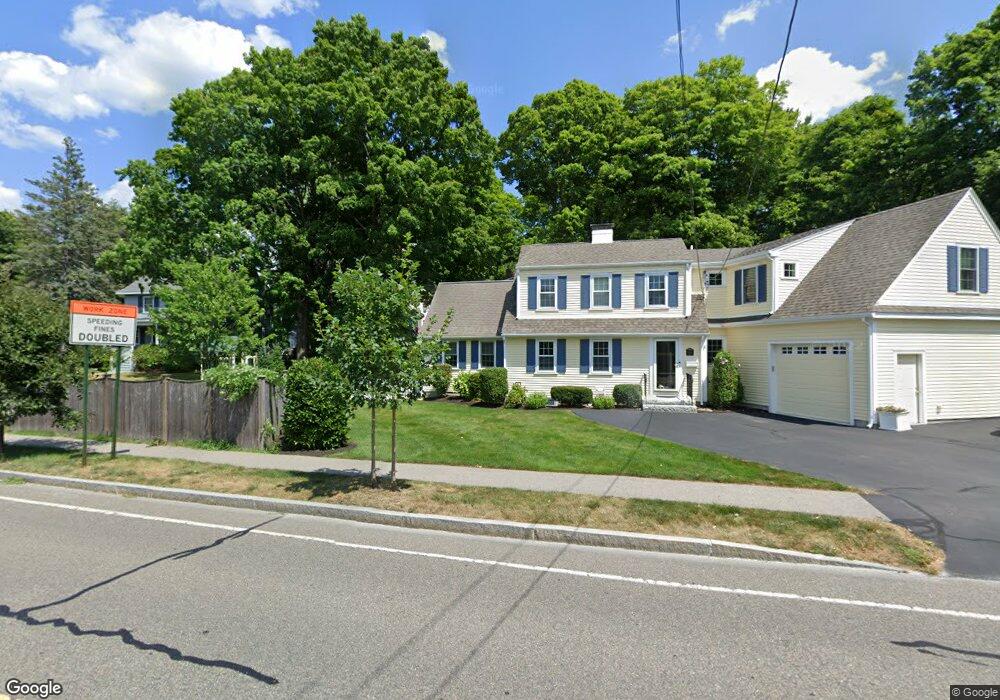
21 Mercer Rd Needham Heights, MA 02494
Estimated Value: $704,000 - $989,112
2
Beds
2
Baths
660
Sq Ft
$1,384/Sq Ft
Est. Value
About This Home
This home is located at 21 Mercer Rd, Needham Heights, MA 02494 and is currently estimated at $913,278, approximately $1,383 per square foot. 21 Mercer Rd is a home located in Norfolk County with nearby schools including Eliot Elementary School, High Rock Middle School, and Pollard Middle School.
Ownership History
Date
Name
Owned For
Owner Type
Purchase Details
Closed on
Mar 19, 2025
Sold by
Osborn Michael E
Bought by
Michael E Osborn Ret and Osborn
Current Estimated Value
Purchase Details
Closed on
Oct 11, 2007
Sold by
Osborn Michael E and Osborn Teresa J
Bought by
Osborn Michael E
Purchase Details
Closed on
Jun 28, 1995
Sold by
Shaw Beryl M
Bought by
Osborn Michael E and Osborn Teresa J
Home Financials for this Owner
Home Financials are based on the most recent Mortgage that was taken out on this home.
Original Mortgage
$155,000
Interest Rate
7.8%
Mortgage Type
Purchase Money Mortgage
Create a Home Valuation Report for This Property
The Home Valuation Report is an in-depth analysis detailing your home's value as well as a comparison with similar homes in the area
Home Values in the Area
Average Home Value in this Area
Purchase History
| Date | Buyer | Sale Price | Title Company |
|---|---|---|---|
| Michael E Osborn Ret | -- | None Available | |
| Michael E Osborn Ret | -- | None Available | |
| Osborn Michael E | -- | -- | |
| Osborn Michael E | -- | -- | |
| Osborn Michael E | $195,100 | -- | |
| Osborn Michael E | $195,100 | -- |
Source: Public Records
Mortgage History
| Date | Status | Borrower | Loan Amount |
|---|---|---|---|
| Previous Owner | Osborn Michael E | $149,300 | |
| Previous Owner | Osborn Michael E | $155,000 |
Source: Public Records
Tax History Compared to Growth
Tax History
| Year | Tax Paid | Tax Assessment Tax Assessment Total Assessment is a certain percentage of the fair market value that is determined by local assessors to be the total taxable value of land and additions on the property. | Land | Improvement |
|---|---|---|---|---|
| 2025 | $8,880 | $837,700 | $732,400 | $105,300 |
| 2024 | $7,560 | $603,800 | $472,500 | $131,300 |
| 2023 | $7,722 | $592,200 | $472,500 | $119,700 |
| 2022 | $7,194 | $538,100 | $421,800 | $116,300 |
| 2021 | $7,011 | $538,100 | $421,800 | $116,300 |
| 2020 | $6,653 | $532,700 | $422,100 | $110,600 |
| 2019 | $6,112 | $493,300 | $383,700 | $109,600 |
| 2018 | $5,860 | $493,300 | $383,700 | $109,600 |
| 2017 | $5,718 | $480,900 | $383,700 | $97,200 |
| 2016 | $5,566 | $482,300 | $383,700 | $98,600 |
| 2015 | $5,445 | $482,300 | $383,700 | $98,600 |
| 2014 | $4,839 | $415,700 | $319,800 | $95,900 |
Source: Public Records
Map
Nearby Homes
- 77 High St
- 400 Hunnewell St Unit 103
- 36 Davenport Rd
- 403 Hunnewell St Unit 403
- 379 Hunnewell St Unit 379
- 7 Avery St
- 3 Crescent Rd
- 445 Hillside Ave
- 62 Evelyn Rd
- 143 Hunting Rd
- 35 Andrea Cir
- 9 Jayne Rd
- 556 Webster St
- 34 Pershing Rd
- 12 Hill St
- 41 Lee Rd
- 443 Central Ave
- 23 Cheney St
- 345 Central Ave
- 190 Brookline St
- 348 Webster St
- 326 Webster St
- 15 Mercer Rd
- 22 Mercer Rd
- 22 Mercer Rd
- 28 Mercer Rd
- 10 Mercer Rd
- 58-60 Webster St
- 45 Park Ave
- 9 Mercer Rd
- 354 Webster St
- 51 Park Ave
- 33 Park Ave
- 312 Webster St
- 314 Webster St Unit 1A
- 314 Webster St
- 314 Webster St Unit B
- 314 Webster St Unit A
- 45 Greendale Ave
- 321 Webster St