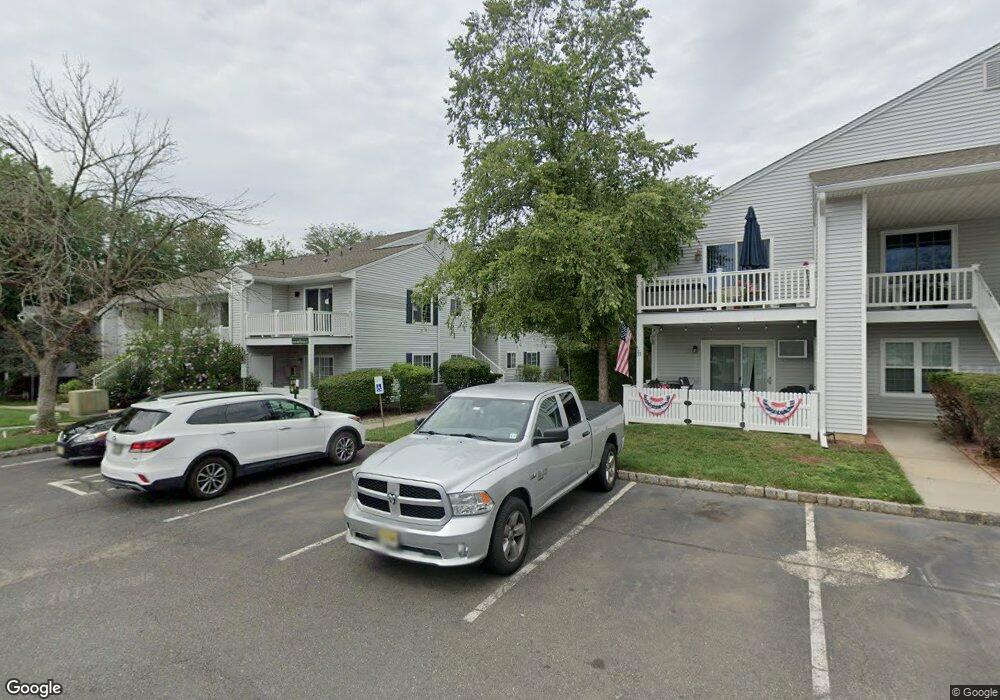
21 Mountain Ct Unit 4421 Bedminster, NJ 07921
Estimated Value: $129,000 - $170,000
--
Bed
--
Bath
546
Sq Ft
$286/Sq Ft
Est. Value
About This Home
This home is located at 21 Mountain Ct Unit 4421, Bedminster, NJ 07921 and is currently estimated at $156,061, approximately $285 per square foot. 21 Mountain Ct Unit 4421 is a home located in Somerset County with nearby schools including Bedminster Township School, Guidepost Montessori at Bridgewater, and Far Hills Country Day School.
Ownership History
Date
Name
Owned For
Owner Type
Purchase Details
Closed on
Sep 7, 2018
Sold by
Zurek Alina and Zurek Romuald
Bought by
Beran Peter W
Current Estimated Value
Home Financials for this Owner
Home Financials are based on the most recent Mortgage that was taken out on this home.
Original Mortgage
$69,000
Outstanding Balance
$59,719
Interest Rate
4.25%
Mortgage Type
Adjustable Rate Mortgage/ARM
Estimated Equity
$96,342
Purchase Details
Closed on
Apr 30, 2009
Sold by
Howell Teresa L
Bought by
Zurek Alina
Purchase Details
Closed on
May 6, 1999
Sold by
Minerley Dave
Bought by
Iervolino Joanna
Home Financials for this Owner
Home Financials are based on the most recent Mortgage that was taken out on this home.
Original Mortgage
$44,450
Interest Rate
6.88%
Create a Home Valuation Report for This Property
The Home Valuation Report is an in-depth analysis detailing your home's value as well as a comparison with similar homes in the area
Home Values in the Area
Average Home Value in this Area
Purchase History
| Date | Buyer | Sale Price | Title Company |
|---|---|---|---|
| Beran Peter W | $99,000 | Westcor Land Title Ins Co | |
| Zurek Alina | $79,405 | Chicago Title Insurance Co | |
| Iervolino Joanna | $49,428 | -- |
Source: Public Records
Mortgage History
| Date | Status | Borrower | Loan Amount |
|---|---|---|---|
| Open | Beran Peter W | $69,000 | |
| Previous Owner | Iervolino Joanna | $44,450 | |
| Closed | Zurek Alina | $0 |
Source: Public Records
Tax History Compared to Growth
Tax History
| Year | Tax Paid | Tax Assessment Tax Assessment Total Assessment is a certain percentage of the fair market value that is determined by local assessors to be the total taxable value of land and additions on the property. | Land | Improvement |
|---|---|---|---|---|
| 2025 | $1,186 | $97,200 | $17,500 | $79,700 |
| 2024 | $1,186 | $93,400 | $16,800 | $76,600 |
| 2023 | $1,215 | $90,700 | $16,300 | $74,400 |
| 2022 | $1,210 | $88,100 | $15,800 | $72,300 |
| 2021 | $1,141 | $85,700 | $15,500 | $70,200 |
| 2020 | $1,162 | $84,000 | $15,200 | $68,800 |
| 2019 | $1,141 | $83,000 | $15,000 | $68,000 |
| 2018 | $1,071 | $78,900 | $14,700 | $64,200 |
| 2017 | $1,088 | $78,900 | $14,700 | $64,200 |
| 2016 | $1,051 | $77,300 | $14,400 | $62,900 |
| 2015 | $1,021 | $75,100 | $14,000 | $61,100 |
| 2014 | $988 | $72,200 | $13,400 | $58,800 |
Source: Public Records
Map
Nearby Homes
- 66 Mountain Ct Unit 4766
- 22 Tansy Ct
- 9 Stone Run Rd
- 41 Cambridge Rd
- 13 Eton Ct
- 1002 Timberbrooke Dr
- 2 Berkley Ln
- 6 Ray Ct Unit 13706
- 15 Ray Ct
- 6 Wood Duck Pond Road Ondo
- 25 Spruce Ct
- 328 Enclave Ln
- 39 Academy Ct
- 25 Stevens Ct
- 22 Morgan Ct
- 10 Morgan Ct
- 14 Sussex Ct
- 971 Washington Valley Rd
- 21 Parkside Rd
- 4 Hansom Rd
- 17 Mountain Ct
- 24 Mountain Ct Unit 4424
- 22 Mountain Ct
- 18 Mountain Ct Unit 4418
- 23 Mountain Ct
- 26 Mountain Ct
- 19 Mountain Ct
- 20 Mountain Ct Unit 4420
- 25 Mountain Ct
- 27 Mountain Ct Unit 4427
- 28 Mountain Ct
- 1 Mountain Ct
- 14 Mountain Ct
- 48 Mountain Ct Unit 4648
- 46 Mountain Ct Unit 4646
- 44 Mountain Ct Unit 4644
- 10 Mountain Ct
- 9 Mountain Ct
- 47 Mountain Ct
- 45 Mountain Ct