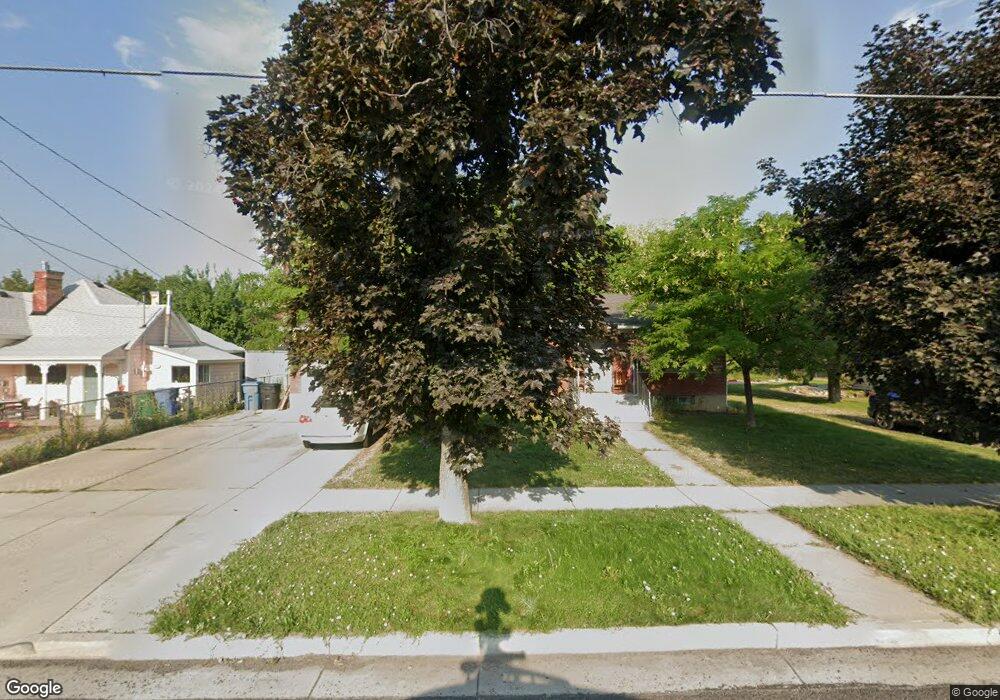
21 N 400 W Logan, UT 84321
Ellis NeighborhoodEstimated Value: $380,000 - $553,000
4
Beds
2
Baths
2,400
Sq Ft
$183/Sq Ft
Est. Value
About This Home
This home is located at 21 N 400 W, Logan, UT 84321 and is currently estimated at $439,748, approximately $183 per square foot. 21 N 400 W is a home located in Cache County with nearby schools including Ellis School, Mount Logan Middle School, and Logan High School.
Ownership History
Date
Name
Owned For
Owner Type
Purchase Details
Closed on
Aug 18, 2021
Sold by
Sorensen Kenneth P and Sorensen Karen
Bought by
Strong Mckenna and Strong James
Current Estimated Value
Home Financials for this Owner
Home Financials are based on the most recent Mortgage that was taken out on this home.
Original Mortgage
$356,250
Outstanding Balance
$323,242
Interest Rate
2.9%
Mortgage Type
New Conventional
Estimated Equity
$116,506
Purchase Details
Closed on
Jan 15, 2015
Sold by
Gh Real Estate Llc
Bought by
Sorensen Kenneth P and Sorensen Karen
Home Financials for this Owner
Home Financials are based on the most recent Mortgage that was taken out on this home.
Original Mortgage
$119,600
Interest Rate
3.82%
Mortgage Type
New Conventional
Purchase Details
Closed on
May 9, 2008
Sold by
Macare Marcia S
Bought by
Hess Matthew V and Macare Land Trust
Create a Home Valuation Report for This Property
The Home Valuation Report is an in-depth analysis detailing your home's value as well as a comparison with similar homes in the area
Home Values in the Area
Average Home Value in this Area
Purchase History
| Date | Buyer | Sale Price | Title Company |
|---|---|---|---|
| Strong Mckenna | -- | Northern Title Company | |
| Sorensen Kenneth P | -- | Advanced Title | |
| Hess Matthew V | -- | Hickman Land Title Company |
Source: Public Records
Mortgage History
| Date | Status | Borrower | Loan Amount |
|---|---|---|---|
| Open | Strong Mckenna | $356,250 | |
| Previous Owner | Sorensen Kenneth P | $119,600 |
Source: Public Records
Tax History Compared to Growth
Tax History
| Year | Tax Paid | Tax Assessment Tax Assessment Total Assessment is a certain percentage of the fair market value that is determined by local assessors to be the total taxable value of land and additions on the property. | Land | Improvement |
|---|---|---|---|---|
| 2025 | $1,630 | $210,770 | $0 | $0 |
| 2024 | $1,673 | $209,610 | $0 | $0 |
| 2023 | $1,727 | $206,250 | $0 | $0 |
| 2022 | $2,135 | $206,250 | $0 | $0 |
| 2021 | $1,761 | $303,300 | $42,000 | $261,300 |
| 2020 | $1,567 | $243,000 | $42,000 | $201,000 |
| 2019 | $1,638 | $243,000 | $42,000 | $201,000 |
| 2018 | $1,155 | $156,352 | $42,000 | $114,352 |
| 2017 | $1,107 | $79,255 | $0 | $0 |
| 2016 | $1,148 | $73,755 | $0 | $0 |
| 2015 | $1,069 | $73,755 | $0 | $0 |
| 2014 | $966 | $73,755 | $0 | $0 |
| 2013 | -- | $73,245 | $0 | $0 |
Source: Public Records
Map
Nearby Homes