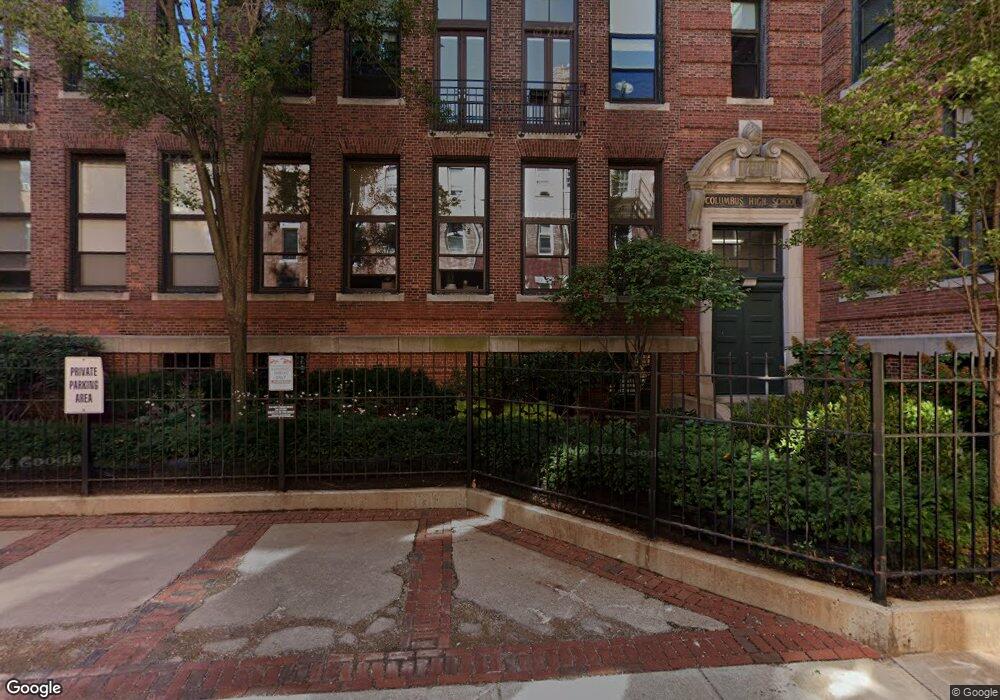
21 N Bennet St Unit 2L Boston, MA 02113
North End NeighborhoodEstimated Value: $1,290,000 - $1,551,000
2
Beds
2
Baths
1,034
Sq Ft
$1,327/Sq Ft
Est. Value
About This Home
This home is located at 21 N Bennet St Unit 2L, Boston, MA 02113 and is currently estimated at $1,372,300, approximately $1,327 per square foot. 21 N Bennet St Unit 2L is a home located in Suffolk County with nearby schools including St John School, Boston Children's School, and Torit Montessori School.
Ownership History
Date
Name
Owned For
Owner Type
Purchase Details
Closed on
Sep 3, 2020
Sold by
Riccio Linda S
Bought by
Nussbaum Irving L and Demoulas Alexis
Current Estimated Value
Home Financials for this Owner
Home Financials are based on the most recent Mortgage that was taken out on this home.
Original Mortgage
$920,000
Outstanding Balance
$816,439
Interest Rate
2.9%
Mortgage Type
Purchase Money Mortgage
Estimated Equity
$555,861
Purchase Details
Closed on
Aug 26, 2011
Sold by
Fabiaschi Debra M
Bought by
Riccio Linda S
Home Financials for this Owner
Home Financials are based on the most recent Mortgage that was taken out on this home.
Original Mortgage
$370,000
Interest Rate
3%
Mortgage Type
Purchase Money Mortgage
Purchase Details
Closed on
Jul 30, 2009
Sold by
Chung Tera
Bought by
Fabiaschi Debra
Purchase Details
Closed on
Aug 5, 2003
Sold by
Watts Mary A
Bought by
Chung Tera
Home Financials for this Owner
Home Financials are based on the most recent Mortgage that was taken out on this home.
Original Mortgage
$506,200
Interest Rate
5.28%
Mortgage Type
Purchase Money Mortgage
Create a Home Valuation Report for This Property
The Home Valuation Report is an in-depth analysis detailing your home's value as well as a comparison with similar homes in the area
Home Values in the Area
Average Home Value in this Area
Purchase History
| Date | Buyer | Sale Price | Title Company |
|---|---|---|---|
| Nussbaum Irving L | $1,150,000 | None Available | |
| Riccio Linda S | $830,000 | -- | |
| Fabiaschi Debra | $820,000 | -- | |
| Chung Tera | $675,000 | -- |
Source: Public Records
Mortgage History
| Date | Status | Borrower | Loan Amount |
|---|---|---|---|
| Open | Nussbaum Irving L | $920,000 | |
| Previous Owner | Riccio Linda S | $370,000 | |
| Previous Owner | Chung Tera | $506,200 |
Source: Public Records
Tax History Compared to Growth
Tax History
| Year | Tax Paid | Tax Assessment Tax Assessment Total Assessment is a certain percentage of the fair market value that is determined by local assessors to be the total taxable value of land and additions on the property. | Land | Improvement |
|---|---|---|---|---|
| 2025 | $13,094 | $1,130,700 | $0 | $1,130,700 |
| 2024 | $12,084 | $1,108,600 | $0 | $1,108,600 |
| 2023 | $11,782 | $1,097,000 | $0 | $1,097,000 |
| 2022 | $11,476 | $1,054,800 | $0 | $1,054,800 |
| 2021 | $11,255 | $1,054,800 | $0 | $1,054,800 |
| 2020 | $10,966 | $1,038,400 | $0 | $1,038,400 |
| 2019 | $10,133 | $961,400 | $0 | $961,400 |
| 2018 | $9,597 | $915,700 | $0 | $915,700 |
| 2017 | $9,853 | $930,447 | $0 | $930,447 |
| 2016 | $9,748 | $886,140 | $0 | $886,140 |
| 2015 | $9,684 | $799,700 | $0 | $799,700 |
| 2014 | $9,048 | $719,200 | $0 | $719,200 |
Source: Public Records
Map
Nearby Homes
- 14 N Bennet St Unit 1
- 14 N Bennet St Unit 2
- 61 Prince St Unit 1C
- 7 Unity St Unit 3
- 144 Salem St
- 133 Salem St
- 0 Fairfield Unit 71812438
- 126 Salem St Unit 3
- 81 Prince St Unit 2
- 115 Salem St Unit 16
- 19 Salutation St Unit 52
- 342-344 North St Unit 1A
- 190 Salem St Unit 2
- 190 Salem St Unit 3
- 21 Moon St Unit 2
- 6 Baldwin Place
- 4-6 Henchman St Unit 4-6
- 24 Sheafe St Unit 1
- 290 North St Unit 4
- 386 Commercial St Unit 4E
- 21 N Bennet St Unit PH5
- 21 N Bennet St Unit PH4
- 21 N Bennet St Unit PH3
- 21 N Bennet St Unit PH2
- 21 N Bennet St Unit PH1B
- 21 N Bennet St Unit PH1A
- 21 N Bennet St Unit 3J
- 21 N Bennet St Unit 3HI
- 21 N Bennet St Unit 3G
- 21 N Bennet St Unit 3M
- 21 N Bennet St Unit 3L
- 21 N Bennet St Unit 3K
- 21 N Bennet St Unit 3A
- 21 N Bennet St Unit 2J
- 21 N Bennet St Unit 2I
- 21 N Bennet St Unit 2H
- 21 N Bennet St Unit 2G
- 21 N Bennet St Unit 2F
- 21 N Bennet St Unit 2E
- 21 N Bennet St Unit 2M