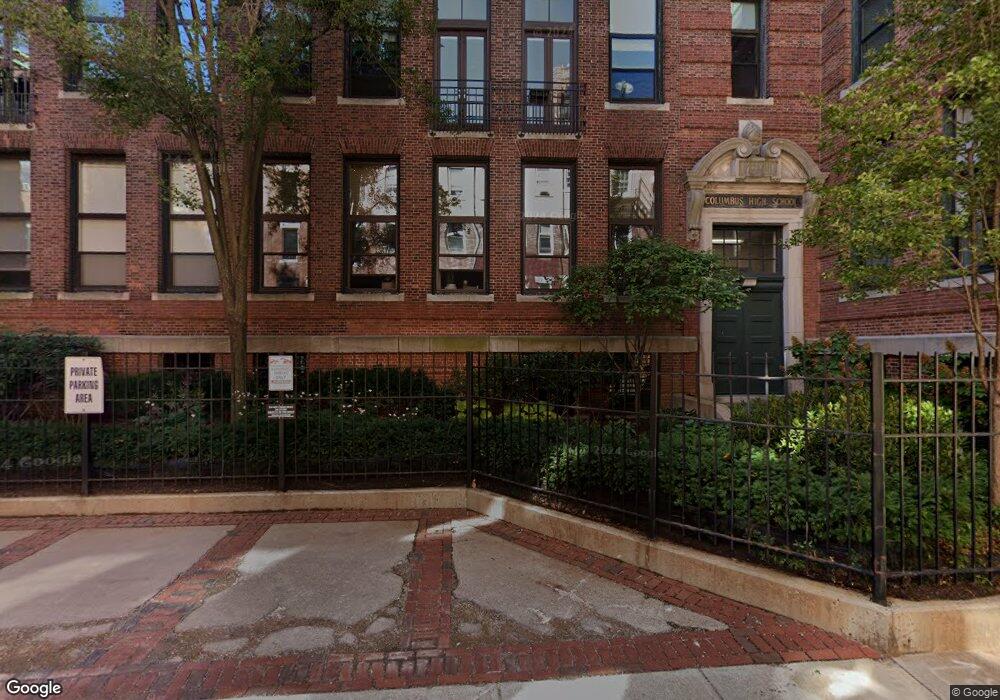
21 N Bennet St Unit 3G Boston, MA 02113
North End NeighborhoodEstimated Value: $826,950 - $958,000
1
Bed
2
Baths
765
Sq Ft
$1,167/Sq Ft
Est. Value
About This Home
This home is located at 21 N Bennet St Unit 3G, Boston, MA 02113 and is currently estimated at $892,738, approximately $1,166 per square foot. 21 N Bennet St Unit 3G is a home located in Suffolk County with nearby schools including St John School, Boston Children's School, and Torit Montessori School.
Ownership History
Date
Name
Owned For
Owner Type
Purchase Details
Closed on
Aug 30, 2018
Sold by
Geetter Darya
Bought by
Woodworth Paul G
Current Estimated Value
Purchase Details
Closed on
Mar 8, 2013
Sold by
Reppert Sibley P and Vezetinski Christine A
Bought by
Geetter Darya
Purchase Details
Closed on
Jul 1, 1998
Sold by
Petrucci Daniel P
Bought by
Abegglen Andrea K
Home Financials for this Owner
Home Financials are based on the most recent Mortgage that was taken out on this home.
Original Mortgage
$227,250
Interest Rate
7.04%
Mortgage Type
Purchase Money Mortgage
Purchase Details
Closed on
Nov 19, 1997
Sold by
T Downing Llc
Bought by
Petrucci Daniel P
Home Financials for this Owner
Home Financials are based on the most recent Mortgage that was taken out on this home.
Original Mortgage
$214,000
Interest Rate
7.17%
Mortgage Type
Purchase Money Mortgage
Create a Home Valuation Report for This Property
The Home Valuation Report is an in-depth analysis detailing your home's value as well as a comparison with similar homes in the area
Home Values in the Area
Average Home Value in this Area
Purchase History
| Date | Buyer | Sale Price | Title Company |
|---|---|---|---|
| Woodworth Paul G | $819,000 | -- | |
| Geetter Darya | $663,750 | -- | |
| Abegglen Andrea K | $312,000 | -- | |
| Petrucci Daniel P | $262,170 | -- |
Source: Public Records
Mortgage History
| Date | Status | Borrower | Loan Amount |
|---|---|---|---|
| Previous Owner | Petrucci Daniel P | $333,450 | |
| Previous Owner | Petrucci Daniel P | $227,250 | |
| Previous Owner | Petrucci Daniel P | $214,000 | |
| Closed | Petrucci Daniel P | $26,750 | |
| Closed | Petrucci Daniel P | $38,050 |
Source: Public Records
Tax History Compared to Growth
Tax History
| Year | Tax Paid | Tax Assessment Tax Assessment Total Assessment is a certain percentage of the fair market value that is determined by local assessors to be the total taxable value of land and additions on the property. | Land | Improvement |
|---|---|---|---|---|
| 2025 | $9,115 | $787,100 | $0 | $787,100 |
| 2024 | $8,412 | $771,700 | $0 | $771,700 |
| 2023 | $8,201 | $763,600 | $0 | $763,600 |
| 2022 | $7,988 | $734,200 | $0 | $734,200 |
| 2021 | $7,834 | $734,200 | $0 | $734,200 |
| 2020 | $7,804 | $739,000 | $0 | $739,000 |
| 2019 | $7,211 | $684,200 | $0 | $684,200 |
| 2018 | $6,830 | $651,700 | $0 | $651,700 |
| 2017 | $7,478 | $706,104 | $0 | $706,104 |
| 2016 | $7,397 | $672,480 | $0 | $672,480 |
| 2015 | $7,084 | $585,000 | $0 | $585,000 |
| 2014 | $6,618 | $526,100 | $0 | $526,100 |
Source: Public Records
Map
Nearby Homes
- 14 N Bennet St Unit 1
- 14 N Bennet St Unit 2
- 61 Prince St Unit 1C
- 133 Salem St
- 115 Salem St Unit 16
- 144 Salem St
- 126 Salem St Unit 3
- 0 Fairfield Unit 71812438
- 7 Unity St Unit 3
- 81 Prince St Unit 2
- 21 Moon St Unit 2
- 6 Baldwin Place
- 342-344 North St Unit 1A
- 19 Salutation St Unit 52
- 290 North St Unit 4
- 11 Wiget St Unit 11-4
- 190 Salem St Unit 2
- 190 Salem St Unit 3
- 24 Sheafe St Unit 1
- 4-6 Henchman St Unit 4-6
- 21 N Bennet St Unit PH5
- 21 N Bennet St Unit PH4
- 21 N Bennet St Unit PH3
- 21 N Bennet St Unit PH2
- 21 N Bennet St Unit PH1B
- 21 N Bennet St Unit PH1A
- 21 N Bennet St Unit 3J
- 21 N Bennet St Unit 3HI
- 21 N Bennet St Unit 3M
- 21 N Bennet St Unit 3L
- 21 N Bennet St Unit 3K
- 21 N Bennet St Unit 3A
- 21 N Bennet St Unit 2J
- 21 N Bennet St Unit 2I
- 21 N Bennet St Unit 2H
- 21 N Bennet St Unit 2G
- 21 N Bennet St Unit 2F
- 21 N Bennet St Unit 2E
- 21 N Bennet St Unit 2M
- 21 N Bennet St Unit 2L