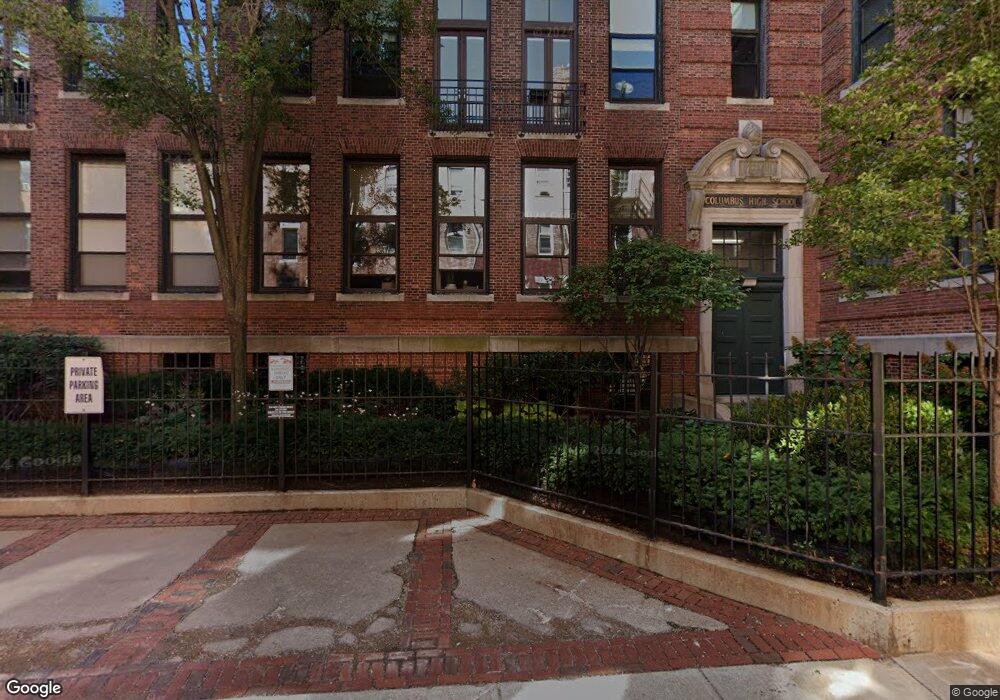
21 N Bennet St Unit 3J Boston, MA 02113
North End NeighborhoodEstimated Value: $1,383,000 - $1,536,000
2
Beds
2
Baths
1,234
Sq Ft
$1,199/Sq Ft
Est. Value
About This Home
This home is located at 21 N Bennet St Unit 3J, Boston, MA 02113 and is currently estimated at $1,479,672, approximately $1,199 per square foot. 21 N Bennet St Unit 3J is a home located in Suffolk County with nearby schools including St John School, Boston Children's School, and Torit Montessori School.
Ownership History
Date
Name
Owned For
Owner Type
Purchase Details
Closed on
Apr 18, 2025
Sold by
Pauline L Dessertine Ret and Dessertine
Bought by
Joseph F Ahearn Jr Ret and Ahearn
Current Estimated Value
Purchase Details
Closed on
Feb 14, 2025
Sold by
Komori Mitsuko and Ahearn Joseph F
Bought by
Joseph F Ahearn Jr Ret and Ahearn
Purchase Details
Closed on
Aug 22, 2022
Sold by
Basile Joseph J and Sweeney Sheelah M
Bought by
Ahearn Joseph F and Komori Mitsuko
Purchase Details
Closed on
May 18, 2007
Sold by
Kasnow Jordan P and Krasnow Jean H
Bought by
Basile Joseph J and Sweeney Sheelah M
Purchase Details
Closed on
Jun 1, 2004
Sold by
Lewis Kathleen M
Bought by
Krasnow Jordan P and Krasnow Jean H
Purchase Details
Closed on
May 25, 1999
Sold by
Savage Michael A and Savage Christine P
Bought by
Lewis Kathleen M
Purchase Details
Closed on
Nov 25, 1997
Sold by
T Downing Llc and Wyman Owen Co Inc
Bought by
Savage Christine P and Savage Michael A
Create a Home Valuation Report for This Property
The Home Valuation Report is an in-depth analysis detailing your home's value as well as a comparison with similar homes in the area
Home Values in the Area
Average Home Value in this Area
Purchase History
| Date | Buyer | Sale Price | Title Company |
|---|---|---|---|
| Joseph F Ahearn Jr Ret | $1,500,000 | None Available | |
| Joseph F Ahearn Jr Ret | $1,500,000 | None Available | |
| Joseph F Ahearn Jr Ret | $1,500,000 | None Available | |
| Joseph F Ahearn Jr Ret | -- | None Available | |
| Joseph F Ahearn Jr Ret | -- | None Available | |
| Ahearn Joseph F | $1,595,000 | None Available | |
| Ahearn Joseph F | $1,595,000 | None Available | |
| Basile Joseph J | $938,000 | -- | |
| Basile Joseph J | $938,000 | -- | |
| Basile Joseph J | $938,000 | -- | |
| Krasnow Jordan P | $895,000 | -- | |
| Krasnow Jordan P | $895,000 | -- | |
| Lewis Kathleen M | $587,000 | -- | |
| Lewis Kathleen M | $587,000 | -- | |
| Savage Christine P | $403,000 | -- | |
| Savage Christine P | $403,000 | -- |
Source: Public Records
Mortgage History
| Date | Status | Borrower | Loan Amount |
|---|---|---|---|
| Previous Owner | Savage Christine P | $652,250 | |
| Previous Owner | Savage Christine P | $100,000 |
Source: Public Records
Tax History Compared to Growth
Tax History
| Year | Tax Paid | Tax Assessment Tax Assessment Total Assessment is a certain percentage of the fair market value that is determined by local assessors to be the total taxable value of land and additions on the property. | Land | Improvement |
|---|---|---|---|---|
| 2025 | $13,808 | $1,192,400 | $0 | $1,192,400 |
| 2024 | $12,742 | $1,169,000 | $0 | $1,169,000 |
| 2023 | $12,424 | $1,156,800 | $0 | $1,156,800 |
| 2022 | $12,102 | $1,112,300 | $0 | $1,112,300 |
| 2021 | $11,868 | $1,112,300 | $0 | $1,112,300 |
| 2020 | $12,171 | $1,152,600 | $0 | $1,152,600 |
| 2019 | $11,247 | $1,067,100 | $0 | $1,067,100 |
| 2018 | $10,652 | $1,016,400 | $0 | $1,016,400 |
| 2017 | $10,920 | $1,031,184 | $0 | $1,031,184 |
| 2016 | $10,803 | $982,080 | $0 | $982,080 |
| 2015 | $11,100 | $916,600 | $0 | $916,600 |
| 2014 | $10,370 | $824,300 | $0 | $824,300 |
Source: Public Records
Map
Nearby Homes
- 14 N Bennet St Unit 1
- 14 N Bennet St Unit 2
- 61 Prince St Unit 1C
- 133 Salem St
- 115 Salem St Unit 16
- 144 Salem St
- 126 Salem St Unit 3
- 0 Fairfield Unit 71812438
- 7 Unity St Unit 3
- 81 Prince St Unit 2
- 21 Moon St Unit 2
- 6 Baldwin Place
- 342-344 North St Unit 1A
- 19 Salutation St Unit 52
- 290 North St Unit 4
- 11 Wiget St Unit 11-4
- 190 Salem St Unit 2
- 190 Salem St Unit 3
- 24 Sheafe St Unit 1
- 4-6 Henchman St Unit 4-6
- 21 N Bennet St Unit PH5
- 21 N Bennet St Unit PH4
- 21 N Bennet St Unit PH3
- 21 N Bennet St Unit PH2
- 21 N Bennet St Unit PH1B
- 21 N Bennet St Unit PH1A
- 21 N Bennet St Unit 3HI
- 21 N Bennet St Unit 3G
- 21 N Bennet St Unit 3M
- 21 N Bennet St Unit 3L
- 21 N Bennet St Unit 3K
- 21 N Bennet St Unit 3A
- 21 N Bennet St Unit 2J
- 21 N Bennet St Unit 2I
- 21 N Bennet St Unit 2H
- 21 N Bennet St Unit 2G
- 21 N Bennet St Unit 2F
- 21 N Bennet St Unit 2E
- 21 N Bennet St Unit 2M
- 21 N Bennet St Unit 2L