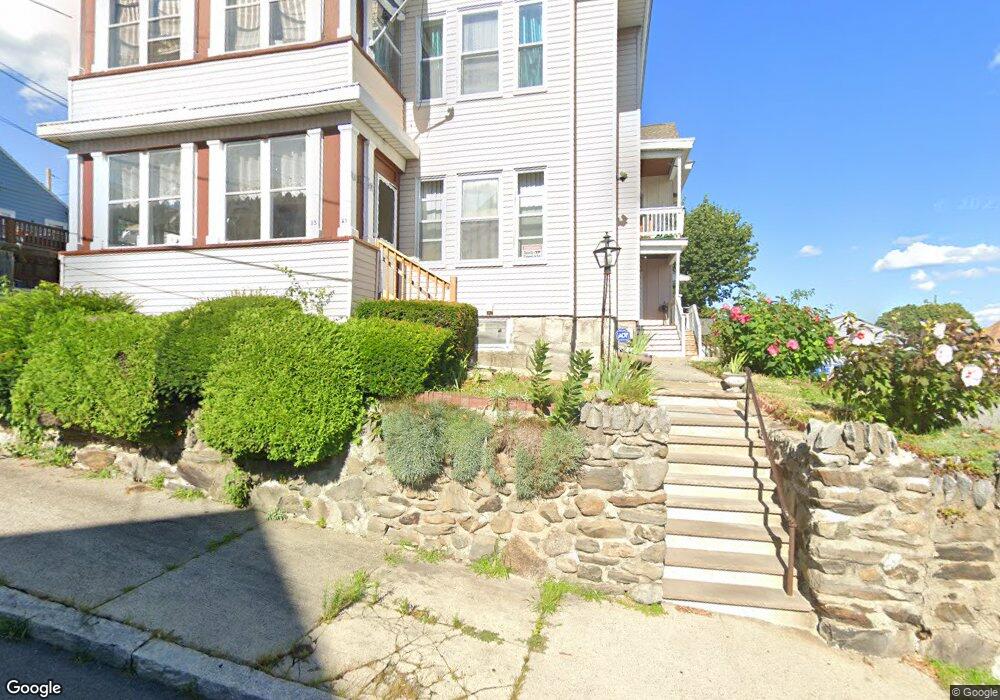
21 Nesmith St Unit 23 Lawrence, MA 01841
Tower Hill NeighborhoodEstimated Value: $876,000 - $983,000
8
Beds
3
Baths
4,049
Sq Ft
$231/Sq Ft
Est. Value
About This Home
This home is located at 21 Nesmith St Unit 23, Lawrence, MA 01841 and is currently estimated at $936,667, approximately $231 per square foot. 21 Nesmith St Unit 23 is a home located in Essex County with nearby schools including Gerard A. Guilmette School, School For Exceptional Studies, and Lawrence Family Development Charter School.
Ownership History
Date
Name
Owned For
Owner Type
Purchase Details
Closed on
Apr 19, 2018
Sold by
Fernandez Freddy and Jimenez Roldaniel
Bought by
Jimenez Roldaniel
Current Estimated Value
Home Financials for this Owner
Home Financials are based on the most recent Mortgage that was taken out on this home.
Original Mortgage
$257,861
Outstanding Balance
$221,383
Interest Rate
4.46%
Mortgage Type
FHA
Estimated Equity
$715,284
Purchase Details
Closed on
Jul 27, 2017
Sold by
Fernandez Freddy
Bought by
Fernandez Freddy
Purchase Details
Closed on
Jan 31, 2011
Sold by
Jimenez Rosendo and Jimenez Silvia
Bought by
Fernandez Freddy
Home Financials for this Owner
Home Financials are based on the most recent Mortgage that was taken out on this home.
Original Mortgage
$146,197
Interest Rate
4.87%
Mortgage Type
FHA
Purchase Details
Closed on
Jul 24, 1996
Sold by
Pekarski Rt
Bought by
Jimenez Silvia
Create a Home Valuation Report for This Property
The Home Valuation Report is an in-depth analysis detailing your home's value as well as a comparison with similar homes in the area
Home Values in the Area
Average Home Value in this Area
Purchase History
| Date | Buyer | Sale Price | Title Company |
|---|---|---|---|
| Jimenez Roldaniel | -- | -- | |
| Fernandez Freddy | -- | -- | |
| Fernandez Freddy | $150,000 | -- | |
| Jimenez Silvia | $110,000 | -- |
Source: Public Records
Mortgage History
| Date | Status | Borrower | Loan Amount |
|---|---|---|---|
| Open | Jimenez Roldaniel | $257,861 | |
| Previous Owner | Fernandez Freddy | $146,197 | |
| Previous Owner | Jimenez Silvia | $172,550 | |
| Previous Owner | Jimenez Silvia | $116,000 |
Source: Public Records
Tax History
| Year | Tax Paid | Tax Assessment Tax Assessment Total Assessment is a certain percentage of the fair market value that is determined by local assessors to be the total taxable value of land and additions on the property. | Land | Improvement |
|---|---|---|---|---|
| 2025 | $6,749 | $766,900 | $139,800 | $627,100 |
| 2024 | $6,501 | $702,800 | $135,300 | $567,500 |
| 2023 | $6,546 | $644,300 | $118,400 | $525,900 |
| 2022 | $5,912 | $516,800 | $110,000 | $406,800 |
| 2021 | $5,607 | $457,000 | $110,000 | $347,000 |
| 2020 | $5,263 | $423,400 | $93,300 | $330,100 |
| 2019 | $5,226 | $382,000 | $80,700 | $301,300 |
| 2018 | $4,348 | $303,600 | $77,100 | $226,500 |
| 2017 | $3,872 | $252,400 | $74,400 | $178,000 |
| 2016 | $3,794 | $244,600 | $52,900 | $191,700 |
| 2015 | $3,596 | $237,800 | $52,900 | $184,900 |
Source: Public Records
Map
Nearby Homes
- 19 Oregon Ave
- 18 Doyle St
- 1082 Essex St
- 1146 Essex St
- 1100 Essex St
- 1008 Essex St Unit 1010
- 95 Hancock St
- 312 Water St Unit 4
- 37 Tewksbury St Unit 39
- 70 Butler St
- 42-44 Cypress Ave
- 13 Caswell Ave
- 14-16 Cypress Ave
- 15 Crescent St Unit D
- 499 Haverhill St
- 82 Water St
- 543 Andover St Unit 6
- 50 Forest St
- 91-93 Newton St
- 76 Haverhill St
- 54 Texas Ave
- 31 Nesmith St
- 64 Oregon Ave
- 20-22 Nesmith St
- 50 Texas Ave
- 20 Nesmith St Unit 22
- 24-26 Nesmith St
- 24 Nesmith St Unit 26
- 16-18 Nesmith St
- 16 Nesmith St Unit 18
- 28-30 Nesmith St
- 28 Nesmith St Unit 30
- 13 Nesmith St Unit 15
- 46 Texas Ave
- 50 Oregon Ave
- 66 Texas Ave Unit 68
- 8 Nesmith St
- 35 Nesmith St
- 66-68 Texas Ave
- 70 Oregon Ave
Your Personal Tour Guide
Ask me questions while you tour the home.