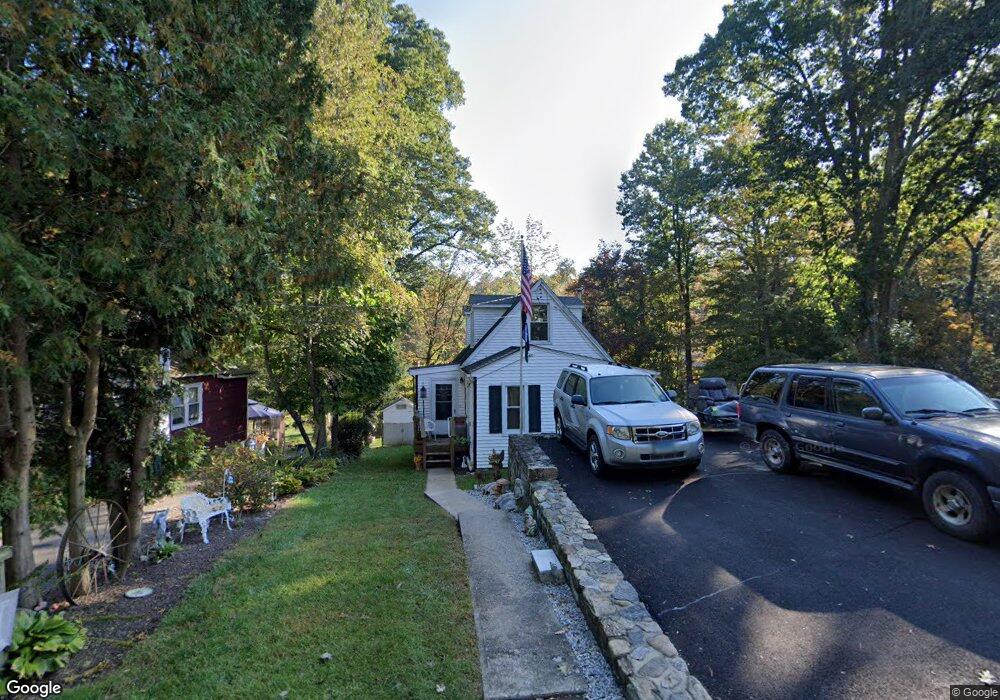
21 Newfane Rd New Fairfield, CT 06812
Estimated Value: $343,774 - $380,000
2
Beds
2
Baths
972
Sq Ft
$377/Sq Ft
Est. Value
About This Home
This home is located at 21 Newfane Rd, New Fairfield, CT 06812 and is currently estimated at $366,194, approximately $376 per square foot. 21 Newfane Rd is a home located in Fairfield County with nearby schools including Meeting House Hill School, New Fairfield Middle School, and New Fairfield High School.
Ownership History
Date
Name
Owned For
Owner Type
Purchase Details
Closed on
Feb 24, 2000
Sold by
Fs Nutmeg and Fs Assoc. L
Bought by
Martin Owen J and Close Lisa A
Current Estimated Value
Home Financials for this Owner
Home Financials are based on the most recent Mortgage that was taken out on this home.
Original Mortgage
$109,800
Interest Rate
8.15%
Purchase Details
Closed on
Nov 4, 1994
Sold by
Foldy Leslie
Bought by
Davies Pamela
Home Financials for this Owner
Home Financials are based on the most recent Mortgage that was taken out on this home.
Original Mortgage
$86,250
Interest Rate
7.25%
Mortgage Type
Unknown
Purchase Details
Closed on
Jun 15, 1990
Sold by
Bochnia Alexander
Bought by
Boguls Leslie
Create a Home Valuation Report for This Property
The Home Valuation Report is an in-depth analysis detailing your home's value as well as a comparison with similar homes in the area
Home Values in the Area
Average Home Value in this Area
Purchase History
| Date | Buyer | Sale Price | Title Company |
|---|---|---|---|
| Martin Owen J | $109,900 | -- | |
| Davies Pamela | $115,000 | -- | |
| Boguls Leslie | $103,000 | -- |
Source: Public Records
Mortgage History
| Date | Status | Borrower | Loan Amount |
|---|---|---|---|
| Open | Boguls Leslie | $210,000 | |
| Closed | Boguls Leslie | $150,000 | |
| Closed | Boguls Leslie | $109,800 | |
| Previous Owner | Boguls Leslie | $86,250 |
Source: Public Records
Tax History Compared to Growth
Tax History
| Year | Tax Paid | Tax Assessment Tax Assessment Total Assessment is a certain percentage of the fair market value that is determined by local assessors to be the total taxable value of land and additions on the property. | Land | Improvement |
|---|---|---|---|---|
| 2025 | $4,105 | $155,900 | $72,400 | $83,500 |
| 2024 | $3,911 | $107,100 | $70,600 | $36,500 |
| 2023 | $3,738 | $107,100 | $70,600 | $36,500 |
| 2022 | $3,478 | $107,100 | $70,600 | $36,500 |
| 2021 | $3,373 | $107,100 | $70,600 | $36,500 |
| 2020 | $3,275 | $107,100 | $70,600 | $36,500 |
| 2019 | $2,954 | $95,600 | $57,600 | $38,000 |
| 2018 | $2,923 | $95,600 | $57,600 | $38,000 |
| 2017 | $2,851 | $95,600 | $57,600 | $38,000 |
| 2016 | $1,558 | $95,600 | $57,600 | $38,000 |
| 2015 | $1,558 | $95,600 | $57,600 | $38,000 |
| 2014 | $2,806 | $107,600 | $63,600 | $44,000 |
Source: Public Records
Map
Nearby Homes
- 5 Hillview Dr W
- 11 Ingleside Rd
- 5 Equestrian Acres
- 20 Manning St
- 45 Ball Pond Rd
- 128 Ball Pond Rd
- 22 Curtis Ave
- 53 Eastwood Rd
- 6 Fulton Dr
- 7 Hampton Rd
- 7 Fox Hollow Rd
- 51 Sherwood Hill Rd
- 747 Milltown Rd
- 4 Autumn Ridge Rd
- 13 Ripley Rd
- 37 Fulton Dr
- 56 Empire Dr
- 424 Gage Rd
- 139 Ball Pond Rd
- 233-235 Haviland Dr