21 Newton St Scituate, MA 02066
Humarock NeighborhoodEstimated Value: $969,000 - $1,380,000
4
Beds
2
Baths
2,256
Sq Ft
$547/Sq Ft
Est. Value
About This Home
This home is located at 21 Newton St, Scituate, MA 02066 and is currently estimated at $1,234,643, approximately $547 per square foot. 21 Newton St is a home.
Ownership History
Date
Name
Owned For
Owner Type
Purchase Details
Closed on
Sep 17, 2025
Sold by
21 Newton Street Nt and Medaglia
Bought by
Medaglia Justin A
Current Estimated Value
Purchase Details
Closed on
Dec 22, 2021
Sold by
Medaglia Anthony J and Medaglia Catherine L
Bought by
21 Newton St Nt and Medaglia
Purchase Details
Closed on
Sep 6, 1983
Bought by
Medaglie Anthony
Create a Home Valuation Report for This Property
The Home Valuation Report is an in-depth analysis detailing your home's value as well as a comparison with similar homes in the area
Home Values in the Area
Average Home Value in this Area
Purchase History
| Date | Buyer | Sale Price | Title Company |
|---|---|---|---|
| Medaglia Justin A | $1,285,000 | -- | |
| 21 Newton St Nt | -- | None Available | |
| Medaglie Anthony | $173,300 | -- |
Source: Public Records
Mortgage History
| Date | Status | Borrower | Loan Amount |
|---|---|---|---|
| Previous Owner | Medaglie Anthony | $250,000 | |
| Previous Owner | Medaglie Anthony | $500,000 |
Source: Public Records
Tax History Compared to Growth
Tax History
| Year | Tax Paid | Tax Assessment Tax Assessment Total Assessment is a certain percentage of the fair market value that is determined by local assessors to be the total taxable value of land and additions on the property. | Land | Improvement |
|---|---|---|---|---|
| 2025 | $11,165 | $1,117,600 | $745,500 | $372,100 |
| 2024 | $8,739 | $843,500 | $622,800 | $220,700 |
| 2023 | $8,025 | $741,500 | $532,900 | $208,600 |
| 2022 | $8,025 | $635,900 | $450,500 | $185,400 |
| 2021 | $7,949 | $596,300 | $429,100 | $167,200 |
| 2020 | $8,004 | $592,900 | $425,400 | $167,500 |
| 2019 | $8,533 | $621,000 | $455,000 | $166,000 |
| 2018 | $9,391 | $673,200 | $499,300 | $173,900 |
| 2017 | $9,485 | $673,200 | $499,300 | $173,900 |
| 2016 | $8,686 | $614,300 | $446,200 | $168,100 |
| 2015 | $8,047 | $614,300 | $446,200 | $168,100 |
Source: Public Records
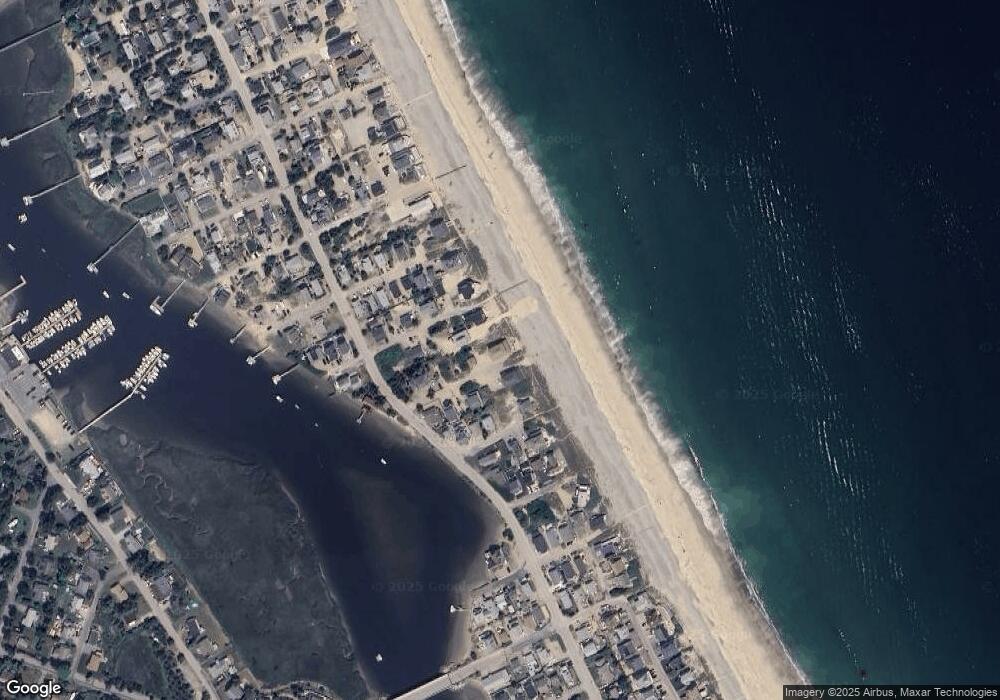
Map
Nearby Homes