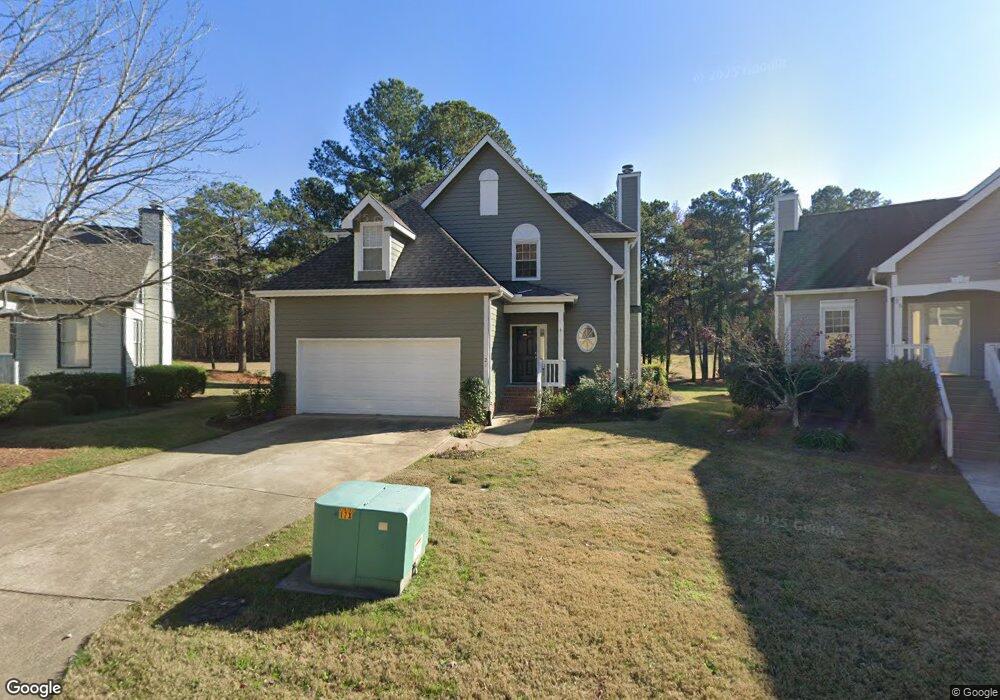
21 Nicklaus Way Clayton, NC 27520
Municipal Park NeighborhoodEstimated Value: $320,947 - $347,000
3
Beds
3
Baths
1,834
Sq Ft
$183/Sq Ft
Est. Value
About This Home
This home is located at 21 Nicklaus Way, Clayton, NC 27520 and is currently estimated at $335,737, approximately $183 per square foot. 21 Nicklaus Way is a home located in Johnston County with nearby schools including Cooper Academy, Riverwood Middle School, and Clayton High.
Ownership History
Date
Name
Owned For
Owner Type
Purchase Details
Closed on
Sep 28, 2023
Sold by
Persico George P
Bought by
Persico George P and Street Lauren C
Current Estimated Value
Purchase Details
Closed on
Oct 15, 2019
Sold by
Calton Paul W and Calton Meredith P
Bought by
Opendoor Property Trust I
Purchase Details
Closed on
Jan 16, 2019
Sold by
Opendoor Property Trust I
Bought by
Persico George P
Home Financials for this Owner
Home Financials are based on the most recent Mortgage that was taken out on this home.
Original Mortgage
$213,000
Interest Rate
3.6%
Mortgage Type
VA
Purchase Details
Closed on
Jul 25, 2006
Sold by
Fjelsted Paul M and Fjelsted Jan E
Bought by
Calton Paul W and Calton Meredith P
Home Financials for this Owner
Home Financials are based on the most recent Mortgage that was taken out on this home.
Original Mortgage
$176,000
Interest Rate
6.74%
Mortgage Type
Purchase Money Mortgage
Purchase Details
Closed on
Mar 2, 2004
Sold by
Fjelsted Paul M
Bought by
Fjelsted Paul M
Create a Home Valuation Report for This Property
The Home Valuation Report is an in-depth analysis detailing your home's value as well as a comparison with similar homes in the area
Home Values in the Area
Average Home Value in this Area
Purchase History
| Date | Buyer | Sale Price | Title Company |
|---|---|---|---|
| Persico George P | $6,500 | None Listed On Document | |
| Persico George P | $6,500 | None Listed On Document | |
| Opendoor Property Trust I | $213,000 | None Available | |
| Persico George P | $213,000 | None Available | |
| Calton Paul W | $176,000 | None Available | |
| Fjelsted Paul M | -- | -- |
Source: Public Records
Mortgage History
| Date | Status | Borrower | Loan Amount |
|---|---|---|---|
| Previous Owner | Persico George P | $213,000 | |
| Previous Owner | Calton Paul W | $176,000 |
Source: Public Records
Tax History Compared to Growth
Tax History
| Year | Tax Paid | Tax Assessment Tax Assessment Total Assessment is a certain percentage of the fair market value that is determined by local assessors to be the total taxable value of land and additions on the property. | Land | Improvement |
|---|---|---|---|---|
| 2025 | $2,143 | $337,500 | $65,000 | $272,500 |
| 2024 | $1,707 | $210,790 | $42,500 | $168,290 |
| 2023 | $1,771 | $210,790 | $42,500 | $168,290 |
| 2022 | $1,786 | $210,790 | $42,500 | $168,290 |
| 2021 | $1,786 | $210,790 | $42,500 | $168,290 |
| 2020 | $1,679 | $191,290 | $42,500 | $148,790 |
| 2019 | $1,679 | $191,290 | $42,500 | $148,790 |
| 2018 | $1,610 | $179,380 | $40,000 | $139,380 |
| 2017 | $1,610 | $179,380 | $40,000 | $139,380 |
| 2016 | $1,574 | $179,380 | $40,000 | $139,380 |
| 2015 | $1,574 | $179,380 | $40,000 | $139,380 |
| 2014 | $1,574 | $179,380 | $40,000 | $139,380 |
Source: Public Records
Map
Nearby Homes
- 20 Nicklaus Way
- 17 Nicklaus Way
- 3604 Willowtree Ln
- 80 Liam St
- 637 Marrian Dr
- 103 Liam St Unit 108
- 55 Pink Iris Ct
- 728 Emerald Bay Cir
- 761 Emerald Bay Cir
- 769 Emerald Bay Cir
- 749 Emerald Bay Cir
- 753 Emerald Bay Cir
- 3525 Deer Trace Ln
- 717 Emerald Bay Cir
- 1217 Jade Valley Trail
- 104 T R Dr
- 953 Jasper Mine Trail
- 653 Emerald Bay Cir
- 720 Emerald Bay Cir
- Eastman III Plan at Edge of Auburn - Classic Collection
- 25 Nicklaus Way
- 13 Nicklaus Way
- 29 Nicklaus Way
- 9 Nicklaus Way
- 33 Nicklaus Way
- 5 Nicklaus Way
- 1 Nicklaus Way
- 5020 Palmer Ct
- 5016 Palmer Ct
- 5012 Palmer Ct
- 5008 Palmer Ct
- 2029 Willow Hill Ln
- 2033 Willow Hill Ln
- 2013 Willow Hill Ln
- 2017 Willow Hill Ln
- 2021 Willow Hill Ln
- 2025 Willow Hill Ln
- 2037 Willow Hill Ln
- 5108 Hogans Way
- 5110 Hogans Way