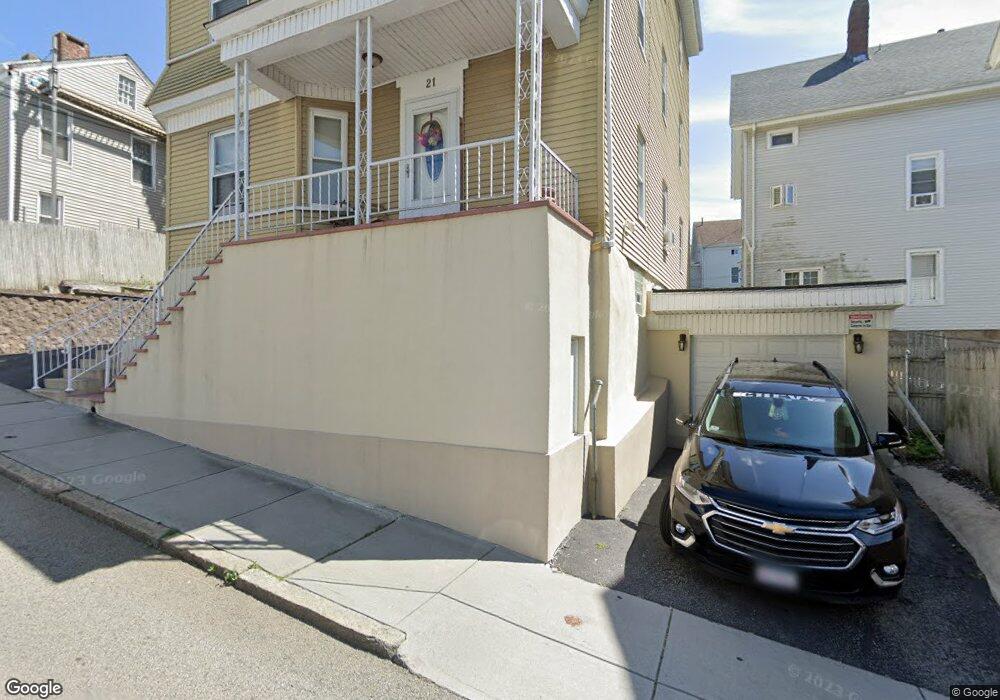
21 Odd St Fall River, MA 02720
Lower Highlands NeighborhoodEstimated Value: $506,114 - $688,000
9
Beds
3
Baths
3,558
Sq Ft
$171/Sq Ft
Est. Value
About This Home
This home is located at 21 Odd St, Fall River, MA 02720 and is currently estimated at $606,779, approximately $170 per square foot. 21 Odd St is a home located in Bristol County with nearby schools including Mary Fonseca Elementary School, Morton Middle School, and B M C Durfee High School.
Ownership History
Date
Name
Owned For
Owner Type
Purchase Details
Closed on
May 4, 2016
Sold by
Furtado-Samanica Alex and Damaral Jose
Bought by
Samanica Alex F
Current Estimated Value
Home Financials for this Owner
Home Financials are based on the most recent Mortgage that was taken out on this home.
Original Mortgage
$227,920
Outstanding Balance
$178,978
Interest Rate
3.25%
Mortgage Type
FHA
Estimated Equity
$427,801
Purchase Details
Closed on
Jul 6, 2007
Sold by
Damaral Jose and Damaral Nuno
Bought by
Samanica Alex Furtado and Damaral Jose
Purchase Details
Closed on
Mar 21, 2006
Sold by
Oliveira Altino M and Oliveira Maria
Bought by
Damaral Jose and Damaral Nuno
Home Financials for this Owner
Home Financials are based on the most recent Mortgage that was taken out on this home.
Original Mortgage
$271,600
Interest Rate
6.27%
Mortgage Type
Purchase Money Mortgage
Purchase Details
Closed on
Apr 1, 2004
Sold by
Furtado Jose F and Oliveira Maria
Bought by
Oliveira Maria
Create a Home Valuation Report for This Property
The Home Valuation Report is an in-depth analysis detailing your home's value as well as a comparison with similar homes in the area
Home Values in the Area
Average Home Value in this Area
Purchase History
| Date | Buyer | Sale Price | Title Company |
|---|---|---|---|
| Samanica Alex F | -- | -- | |
| Samanica Alex Furtado | -- | -- | |
| Damaral Jose | $280,000 | -- | |
| Oliveira Maria | -- | -- |
Source: Public Records
Mortgage History
| Date | Status | Borrower | Loan Amount |
|---|---|---|---|
| Open | Samanica Alex F | $227,920 | |
| Previous Owner | Damaral Jose | $271,600 |
Source: Public Records
Tax History
| Year | Tax Paid | Tax Assessment Tax Assessment Total Assessment is a certain percentage of the fair market value that is determined by local assessors to be the total taxable value of land and additions on the property. | Land | Improvement |
|---|---|---|---|---|
| 2025 | $5,826 | $508,800 | $105,900 | $402,900 |
| 2024 | $5,573 | $485,000 | $102,000 | $383,000 |
| 2023 | $4,910 | $400,200 | $84,300 | $315,900 |
| 2022 | $4,367 | $346,000 | $80,300 | $265,700 |
| 2021 | $4,124 | $298,200 | $76,400 | $221,800 |
| 2020 | $3,708 | $256,600 | $75,300 | $181,300 |
| 2019 | $3,164 | $217,000 | $72,500 | $144,500 |
| 2018 | $3,127 | $213,900 | $78,500 | $135,400 |
| 2017 | $2,943 | $210,200 | $74,800 | $135,400 |
| 2016 | $2,884 | $211,600 | $79,600 | $132,000 |
| 2015 | $2,769 | $211,700 | $79,600 | $132,100 |
| 2014 | $2,792 | $221,900 | $77,300 | $144,600 |
Source: Public Records
Map
Nearby Homes
- 575 N Main St
- 339 Danforth St Unit 6
- 337 Danforth St Unit 7
- 750 Davol St Unit 1012
- 750 Davol St Unit 219
- 750 Davol St Unit 221
- 750 Davol St Unit 616
- 750 Davol St Unit 214
- 9 Doctor St
- 450 Rock St Unit 1
- 11 Dyer St
- 126 June St
- 72 Belmont St
- 267 Lincoln Ave
- 206 Durfee St Unit 1A
- 206 Durfee St Unit 2B
- 206 Durfee St Unit 2A
- 206 Durfee St Unit 1B
- 360 High St
- 499 Maple St
Your Personal Tour Guide
Ask me questions while you tour the home.