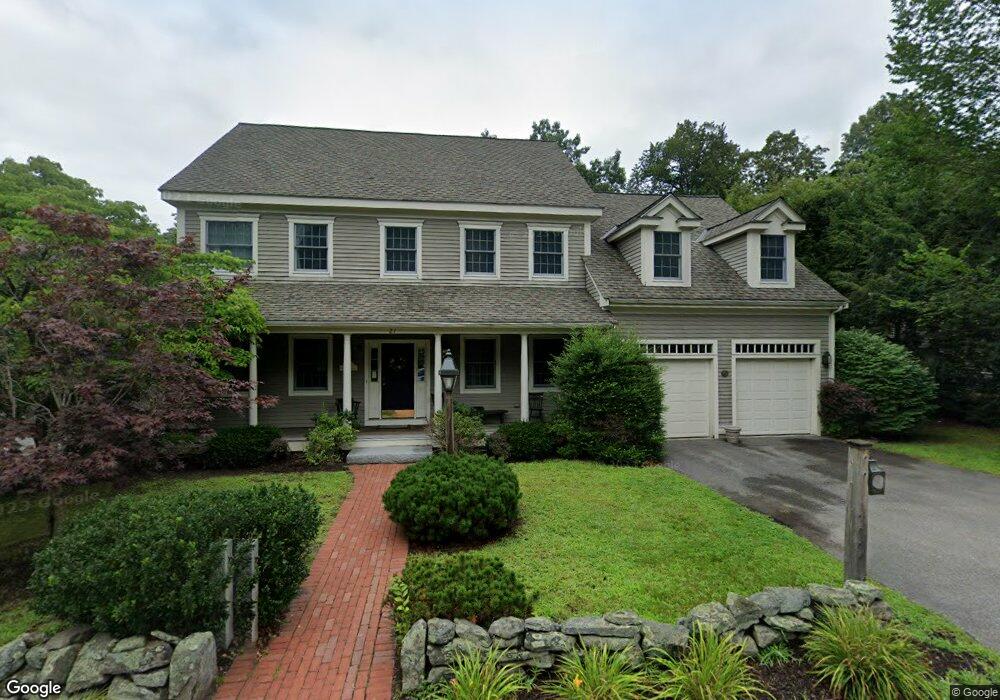
21 Old Bridge Rd Concord, MA 01742
Estimated Value: $1,693,252 - $1,829,000
4
Beds
3
Baths
3,285
Sq Ft
$537/Sq Ft
Est. Value
About This Home
This home is located at 21 Old Bridge Rd, Concord, MA 01742 and is currently estimated at $1,763,563, approximately $536 per square foot. 21 Old Bridge Rd is a home located in Middlesex County with nearby schools including Willard School, Concord Middle School, and Concord Carlisle High School.
Ownership History
Date
Name
Owned For
Owner Type
Purchase Details
Closed on
Jun 29, 2007
Sold by
Dawkins Diana E and Dawkins Thomas C
Bought by
Old Bridge Road Rt and Dawkins Diana E
Current Estimated Value
Purchase Details
Closed on
Aug 17, 2000
Sold by
Creative Dev Assocs
Bought by
Dawkins Thomas C and Dawkins Diana E
Home Financials for this Owner
Home Financials are based on the most recent Mortgage that was taken out on this home.
Original Mortgage
$350,000
Interest Rate
8.13%
Mortgage Type
Purchase Money Mortgage
Purchase Details
Closed on
Dec 16, 1999
Sold by
Mclean Stewart R and Mclean Sheila M
Bought by
Creative Dev Assocs
Home Financials for this Owner
Home Financials are based on the most recent Mortgage that was taken out on this home.
Original Mortgage
$302,018
Interest Rate
7.81%
Mortgage Type
Purchase Money Mortgage
Create a Home Valuation Report for This Property
The Home Valuation Report is an in-depth analysis detailing your home's value as well as a comparison with similar homes in the area
Home Values in the Area
Average Home Value in this Area
Purchase History
| Date | Buyer | Sale Price | Title Company |
|---|---|---|---|
| Old Bridge Road Rt | -- | -- | |
| Dawkins Thomas C | $619,900 | -- | |
| Creative Dev Assocs | $425,000 | -- |
Source: Public Records
Mortgage History
| Date | Status | Borrower | Loan Amount |
|---|---|---|---|
| Previous Owner | Creative Dev Assocs | $350,000 | |
| Previous Owner | Creative Dev Assocs | $302,018 |
Source: Public Records
Tax History
| Year | Tax Paid | Tax Assessment Tax Assessment Total Assessment is a certain percentage of the fair market value that is determined by local assessors to be the total taxable value of land and additions on the property. | Land | Improvement |
|---|---|---|---|---|
| 2025 | $196 | $1,475,300 | $564,100 | $911,200 |
| 2024 | $19,371 | $1,475,300 | $564,100 | $911,200 |
| 2023 | $17,886 | $1,380,100 | $512,800 | $867,300 |
| 2022 | $16,841 | $1,141,000 | $410,200 | $730,800 |
| 2021 | $16,235 | $1,102,900 | $410,200 | $692,700 |
| 2020 | $15,849 | $1,113,800 | $410,200 | $703,600 |
| 2019 | $14,871 | $1,048,000 | $398,300 | $649,700 |
| 2018 | $14,576 | $1,020,000 | $379,300 | $640,700 |
| 2017 | $14,202 | $1,009,400 | $361,300 | $648,100 |
| 2016 | $14,123 | $1,014,600 | $361,300 | $653,300 |
| 2015 | $13,318 | $932,000 | $334,500 | $597,500 |
Source: Public Records
Map
Nearby Homes
- 21 Concord Greene Unit 8
- 16 Concord Greene Unit 5
- 55 Staffordshire Ln Unit B
- 51 Staffordshire Ln
- 111 Central St
- 32 Highland St
- 54 Maple St
- 102 Highland St
- 70 McCallar Ln
- 1 Baker Ave
- 53 Prairie St
- 67 Conant St
- 22 Center Village Dr
- 95 Conant St Unit 320
- 116 Conant St
- 101 Adams Rd
- 79-81 Assabet Ave
- 42 Sunnyside Ln
- 315 Musketaquid Rd
- 66 Old Stow Rd
- 29 Old Bridge Rd
- 17 Crest St
- 1079 Main St
- 1079 Main St
- 8 Crest St
- 10 Crest St
- 10 Crest St Unit 1
- 23 Concord Greene Unit 23
- 23 Concord Greene Unit 3
- 23 Concord Greene Unit 2
- 23 Concord Greene Unit 1
- 23 Concord Greene Unit 4
- 22 Concord Greene Unit 6
- 22 Concord Greene Unit 5
- 22 Concord Greene Unit 4
- 22 Concord Greene Unit 3
- 22 Concord Greene Unit 1
- 22 Concord Greene
- 22 Concord Greene Unit 4 22
- 36 Old Bridge Rd
Your Personal Tour Guide
Ask me questions while you tour the home.