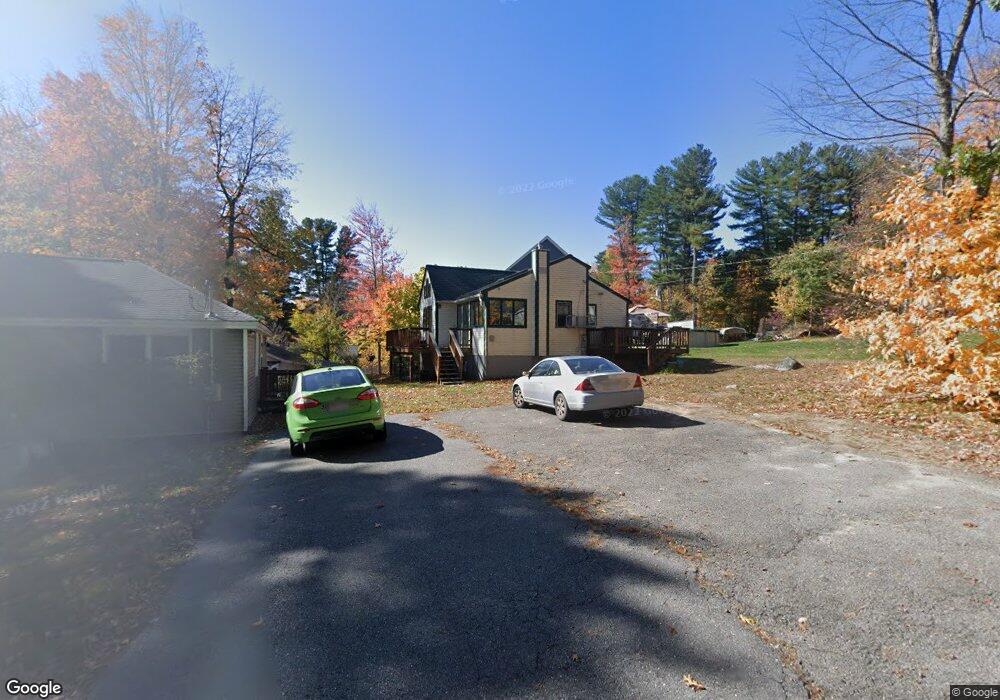
21 Olive Dr Leominster, MA 01453
Estimated Value: $339,000 - $390,000
2
Beds
1
Bath
736
Sq Ft
$492/Sq Ft
Est. Value
About This Home
This home is located at 21 Olive Dr, Leominster, MA 01453 and is currently estimated at $361,800, approximately $491 per square foot. 21 Olive Dr is a home located in Worcester County with nearby schools including Leominster High School, St. Leo School, and St. Anna Catholic School.
Ownership History
Date
Name
Owned For
Owner Type
Purchase Details
Closed on
Mar 23, 2006
Sold by
Nolan James J
Bought by
Jenney Marilyn B
Current Estimated Value
Purchase Details
Closed on
Aug 4, 1997
Sold by
Roose Peter W
Bought by
Nolan James J
Home Financials for this Owner
Home Financials are based on the most recent Mortgage that was taken out on this home.
Original Mortgage
$68,400
Interest Rate
7.55%
Mortgage Type
Purchase Money Mortgage
Purchase Details
Closed on
Nov 20, 1990
Sold by
Mcgarry Harley W
Bought by
Roose Peter W
Create a Home Valuation Report for This Property
The Home Valuation Report is an in-depth analysis detailing your home's value as well as a comparison with similar homes in the area
Home Values in the Area
Average Home Value in this Area
Purchase History
| Date | Buyer | Sale Price | Title Company |
|---|---|---|---|
| Jenney Marilyn B | $180,000 | -- | |
| Nolan James J | $72,000 | -- | |
| Roose Peter W | $35,000 | -- |
Source: Public Records
Mortgage History
| Date | Status | Borrower | Loan Amount |
|---|---|---|---|
| Previous Owner | Roose Peter W | $98,250 | |
| Previous Owner | Roose Peter W | $68,400 |
Source: Public Records
Tax History Compared to Growth
Tax History
| Year | Tax Paid | Tax Assessment Tax Assessment Total Assessment is a certain percentage of the fair market value that is determined by local assessors to be the total taxable value of land and additions on the property. | Land | Improvement |
|---|---|---|---|---|
| 2025 | $4,090 | $291,500 | $111,000 | $180,500 |
| 2024 | $3,971 | $273,700 | $105,700 | $168,000 |
| 2023 | $3,809 | $245,100 | $91,900 | $153,200 |
| 2022 | $3,635 | $219,500 | $79,900 | $139,600 |
| 2021 | $3,294 | $181,700 | $62,200 | $119,500 |
| 2020 | $3,087 | $171,700 | $62,200 | $109,500 |
| 2019 | $2,981 | $160,800 | $59,200 | $101,600 |
| 2018 | $2,698 | $139,600 | $57,500 | $82,100 |
| 2017 | $2,618 | $132,700 | $53,700 | $79,000 |
| 2016 | $2,457 | $125,500 | $53,700 | $71,800 |
| 2015 | $2,360 | $121,400 | $53,700 | $67,700 |
| 2014 | $2,378 | $125,900 | $58,900 | $67,000 |
Source: Public Records
Map
Nearby Homes
- 112 Overlook Dr
- 12 Walden Ct
- 76 Jamestown Rd
- 6 Argentine St
- 109 Weathervane Dr
- 597 Willard St
- 23 Lantern Ln
- 25 Crimson Ct
- 482 Grant St
- 675 Willard St
- 24 Starling Way
- 871 Pleasant St
- 3 Leo Gagnon Way Unit 3
- 1237 Central St Unit 2
- 1237 Central St Unit 15
- 102 Chapman Place Unit 102
- 74 Crisci St
- 197 Chapman Place Unit 197
- 47 Carolyn St
- 35 Hill St