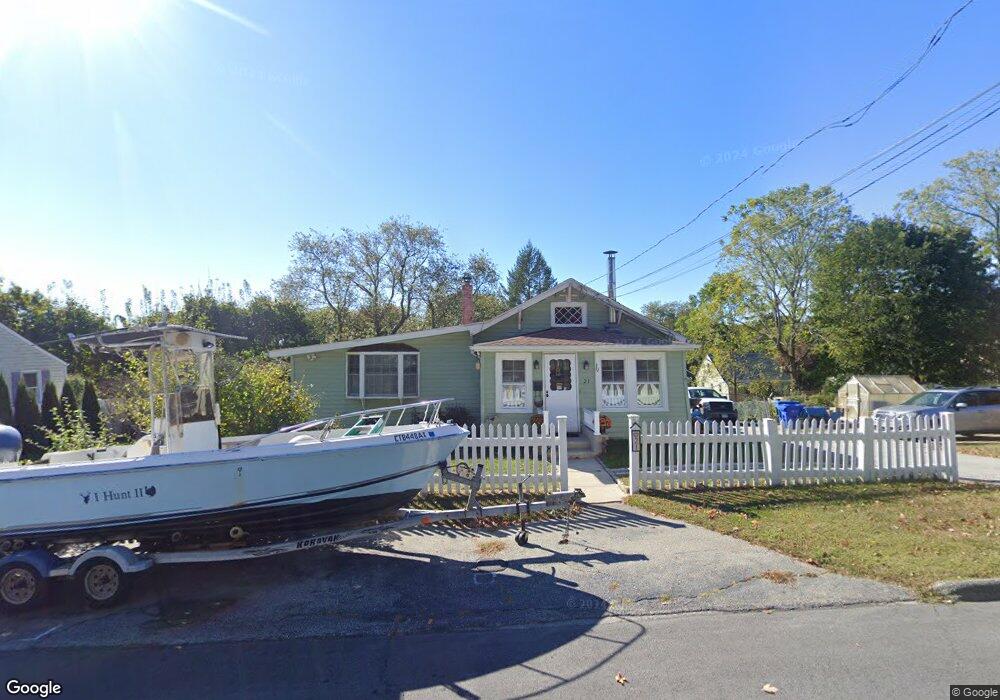
21 Olive St Waterford, CT 06385
Estimated Value: $291,000 - $346,000
2
Beds
1
Bath
1,078
Sq Ft
$292/Sq Ft
Est. Value
About This Home
This home is located at 21 Olive St, Waterford, CT 06385 and is currently estimated at $315,289, approximately $292 per square foot. 21 Olive St is a home located in New London County with nearby schools including Clark Lane Middle School, Waterford High School, and New London High School Multi-Magnet Campus.
Ownership History
Date
Name
Owned For
Owner Type
Purchase Details
Closed on
Feb 26, 2020
Sold by
Lamoureux Angela
Bought by
Trafaconda Peter
Current Estimated Value
Purchase Details
Closed on
Nov 13, 2015
Sold by
Trafaconda Peter S
Bought by
Lamoureux Angela
Purchase Details
Closed on
Aug 26, 2010
Sold by
Trafaconda Peter J and Trafaconda Freda E
Bought by
Trafaconda Peter F and Lamoureux Angela
Purchase Details
Closed on
Aug 9, 1971
Bought by
Lamoureux Angela
Create a Home Valuation Report for This Property
The Home Valuation Report is an in-depth analysis detailing your home's value as well as a comparison with similar homes in the area
Home Values in the Area
Average Home Value in this Area
Purchase History
| Date | Buyer | Sale Price | Title Company |
|---|---|---|---|
| Trafaconda Peter | -- | None Available | |
| Lamoureux Angela | -- | -- | |
| Trafaconda Peter F | -- | -- | |
| Lamoureux Angela | -- | -- |
Source: Public Records
Tax History Compared to Growth
Tax History
| Year | Tax Paid | Tax Assessment Tax Assessment Total Assessment is a certain percentage of the fair market value that is determined by local assessors to be the total taxable value of land and additions on the property. | Land | Improvement |
|---|---|---|---|---|
| 2025 | $3,454 | $147,840 | $62,310 | $85,530 |
| 2024 | $3,297 | $147,840 | $62,310 | $85,530 |
| 2023 | $3,134 | $147,840 | $62,310 | $85,530 |
| 2022 | $3,038 | $110,250 | $46,050 | $64,200 |
| 2021 | $3,047 | $110,250 | $46,050 | $64,200 |
| 2020 | $3,073 | $110,250 | $46,050 | $64,200 |
| 2019 | $3,085 | $110,250 | $46,050 | $64,200 |
| 2018 | $3,023 | $110,250 | $46,050 | $64,200 |
| 2017 | $2,967 | $109,760 | $48,760 | $61,000 |
| 2016 | $2,939 | $109,760 | $48,760 | $61,000 |
| 2015 | $2,835 | $109,760 | $48,760 | $61,000 |
| 2014 | $2,796 | $109,760 | $48,760 | $61,000 |
Source: Public Records
Map
Nearby Homes
- 68 Clark Ln
- 54 Rope Ferry Rd Unit C55
- 54 Rope Ferry Rd Unit D72
- 54 Rope Ferry Rd Unit C45
- 213 Boston Post Rd
- 24 Pine St
- 12 Pine St
- 35 Pine St
- 34 Ivy Hill Rd
- 7 Ivy Hill Rd
- 18 Mackenzie Rd
- 2 Faye St
- 11 Ivy Hill Rd Unit 11
- 5 Windy Ridge Place Unit 5
- 26 Ivy Hill Rd
- 270 Boston Post Rd Unit 22
- 270 Boston Post Rd Unit TRLR 6
- 77 Colman St
- 18 W Pleasant St
- 152 Blydenburg Ave