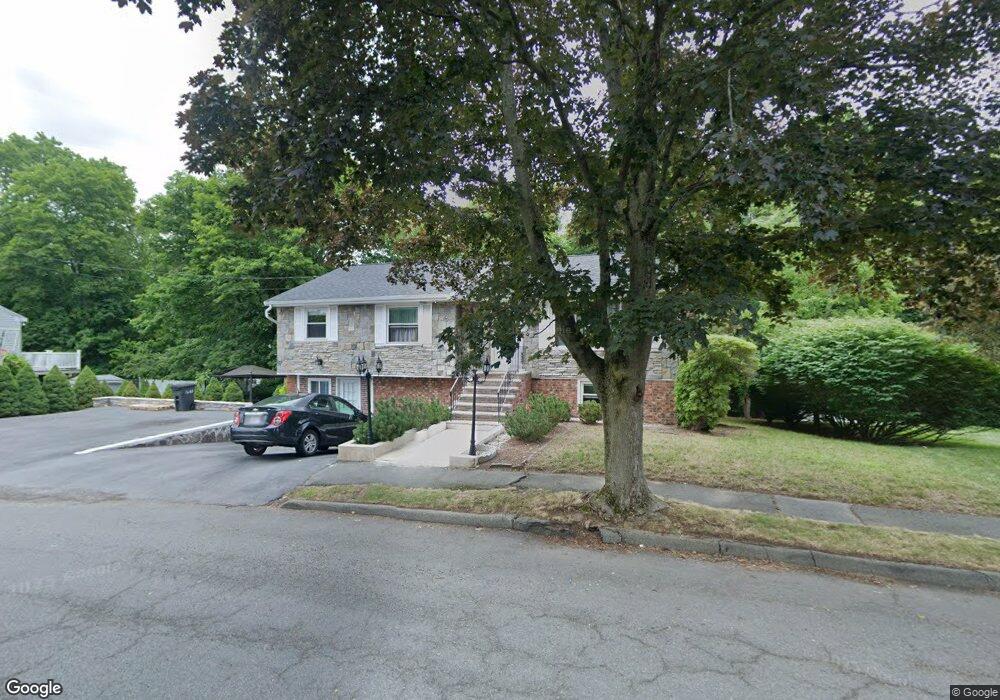
21 Orchard Ave Saugus, MA 01906
Downtown Saugus NeighborhoodEstimated Value: $605,000 - $709,000
3
Beds
2
Baths
1,128
Sq Ft
$602/Sq Ft
Est. Value
About This Home
This home is located at 21 Orchard Ave, Saugus, MA 01906 and is currently estimated at $679,042, approximately $601 per square foot. 21 Orchard Ave is a home located in Essex County with nearby schools including Saugus High School, Pioneer Charter School Of Science II, and Sacred Heart School.
Ownership History
Date
Name
Owned For
Owner Type
Purchase Details
Closed on
Apr 19, 2005
Sold by
Murley Ft
Bought by
Okoye Ogor W
Current Estimated Value
Home Financials for this Owner
Home Financials are based on the most recent Mortgage that was taken out on this home.
Original Mortgage
$324,800
Interest Rate
5.56%
Purchase Details
Closed on
Apr 10, 2000
Sold by
Murley James John and Murley Peter Jason
Bought by
Okoye Ogor W
Create a Home Valuation Report for This Property
The Home Valuation Report is an in-depth analysis detailing your home's value as well as a comparison with similar homes in the area
Home Values in the Area
Average Home Value in this Area
Purchase History
We collect this data history from publicly available records. To have your information removed, we recommend requesting removal directly through your county’s website.
| Date | Buyer | Sale Price | Title Company |
|---|---|---|---|
| Okoye Ogor W | $256,000 | -- | |
| Okoye Ogor W | $256,000 | -- |
Source: Public Records
Mortgage History
We collect this data history from publicly available records. To have your information removed, we recommend requesting removal directly through your county’s website.
| Date | Status | Borrower | Loan Amount |
|---|---|---|---|
| Open | Okoye Ogor W | $409,700 | |
| Closed | Okoye Ogor W | $409,700 | |
| Closed | Okoye Ogor W | $324,800 |
Source: Public Records
Tax History
| Year | Tax Paid | Tax Assessment Tax Assessment Total Assessment is a certain percentage of the fair market value that is determined by local assessors to be the total taxable value of land and additions on the property. | Land | Improvement |
|---|---|---|---|---|
| 2025 | $6,632 | $621,000 | $334,200 | $286,800 |
| 2024 | $6,428 | $603,600 | $325,100 | $278,500 |
| 2023 | $6,113 | $542,900 | $284,500 | $258,400 |
| 2022 | $5,814 | $484,100 | $264,600 | $219,500 |
| 2021 | $5,417 | $439,000 | $219,500 | $219,500 |
| 2020 | $4,898 | $410,900 | $208,600 | $202,300 |
| 2019 | $4,798 | $393,900 | $198,700 | $195,200 |
| 2018 | $4,376 | $377,900 | $189,700 | $188,200 |
| 2017 | $4,077 | $338,300 | $180,600 | $157,700 |
| 2016 | $4,103 | $336,300 | $171,600 | $164,700 |
| 2015 | $3,850 | $320,300 | $163,400 | $156,900 |
| 2014 | $3,699 | $318,600 | $163,400 | $155,200 |
Source: Public Records
Map
Nearby Homes
- 5 Vermont Ave
- 69 Appleton St
- 9 Hood St
- 12C Cheever Ave
- 39 Forest St
- 49 Forest St
- 19 Saville St
- 20 Blacksmith Way
- 12 Stevens Place
- 4 Granite Rd
- 29 Hammersmith Dr
- 9 Nirvana Dr Unit 2E
- 3 Phillips Ave
- 21 Biscayne Ave
- 12 Bisbee Rd
- 2102 Lewis o Gray Dr
- 9 Thomas St Unit 2
- 216 Lynn Fells Pkwy
- 4 Oneil Way
- 1 Twin Springs Dr
Your Personal Tour Guide
Ask me questions while you tour the home.