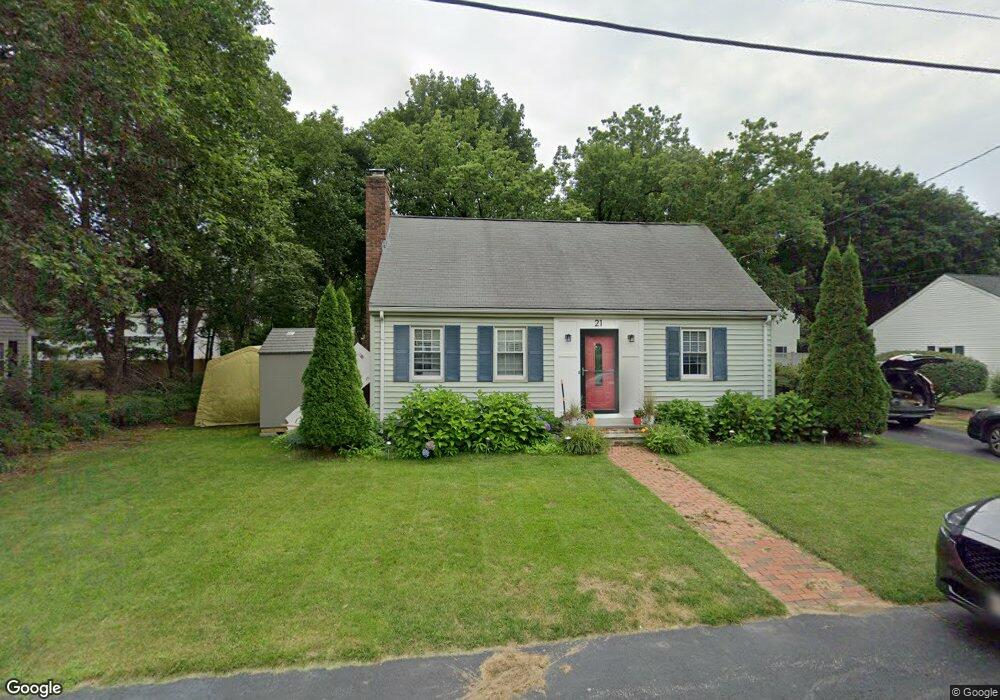
21 Orchard Rd Natick, MA 01760
Estimated Value: $696,689 - $767,000
4
Beds
1
Bath
1,440
Sq Ft
$518/Sq Ft
Est. Value
About This Home
This home is located at 21 Orchard Rd, Natick, MA 01760 and is currently estimated at $745,672, approximately $517 per square foot. 21 Orchard Rd is a home located in Middlesex County with nearby schools including Natick High School, Wilson Middle School, and Bennett-Hemenway (Ben-Hem) Elementary School.
Ownership History
Date
Name
Owned For
Owner Type
Purchase Details
Closed on
Oct 29, 2007
Sold by
Brown Mary L
Bought by
Wolfe Aaron P and Wolfe Lori S
Current Estimated Value
Home Financials for this Owner
Home Financials are based on the most recent Mortgage that was taken out on this home.
Original Mortgage
$280,000
Outstanding Balance
$177,250
Interest Rate
6.39%
Mortgage Type
Purchase Money Mortgage
Estimated Equity
$568,422
Create a Home Valuation Report for This Property
The Home Valuation Report is an in-depth analysis detailing your home's value as well as a comparison with similar homes in the area
Home Values in the Area
Average Home Value in this Area
Purchase History
| Date | Buyer | Sale Price | Title Company |
|---|---|---|---|
| Wolfe Aaron P | $350,000 | -- |
Source: Public Records
Mortgage History
| Date | Status | Borrower | Loan Amount |
|---|---|---|---|
| Open | Wolfe Aaron P | $280,000 |
Source: Public Records
Tax History
| Year | Tax Paid | Tax Assessment Tax Assessment Total Assessment is a certain percentage of the fair market value that is determined by local assessors to be the total taxable value of land and additions on the property. | Land | Improvement |
|---|---|---|---|---|
| 2025 | $7,262 | $607,200 | $403,800 | $203,400 |
| 2024 | $7,008 | $571,600 | $380,000 | $191,600 |
| 2023 | $7,010 | $554,600 | $365,800 | $188,800 |
| 2022 | $5,751 | $431,100 | $332,500 | $98,600 |
| 2021 | $8,135 | $420,200 | $313,500 | $106,700 |
| 2020 | $5,758 | $423,100 | $299,300 | $123,800 |
| 2019 | $5,378 | $423,100 | $299,300 | $123,800 |
| 2018 | $6,771 | $375,400 | $285,000 | $90,400 |
| 2017 | $4,562 | $338,200 | $242,300 | $95,900 |
| 2016 | $4,242 | $312,600 | $217,600 | $95,000 |
| 2015 | $4,215 | $305,000 | $217,600 | $87,400 |
Source: Public Records
Map
Nearby Homes
Your Personal Tour Guide
Ask me questions while you tour the home.