Estimated Value: $491,259 - $532,000
--
Bed
--
Bath
2,155
Sq Ft
$237/Sq Ft
Est. Value
About This Home
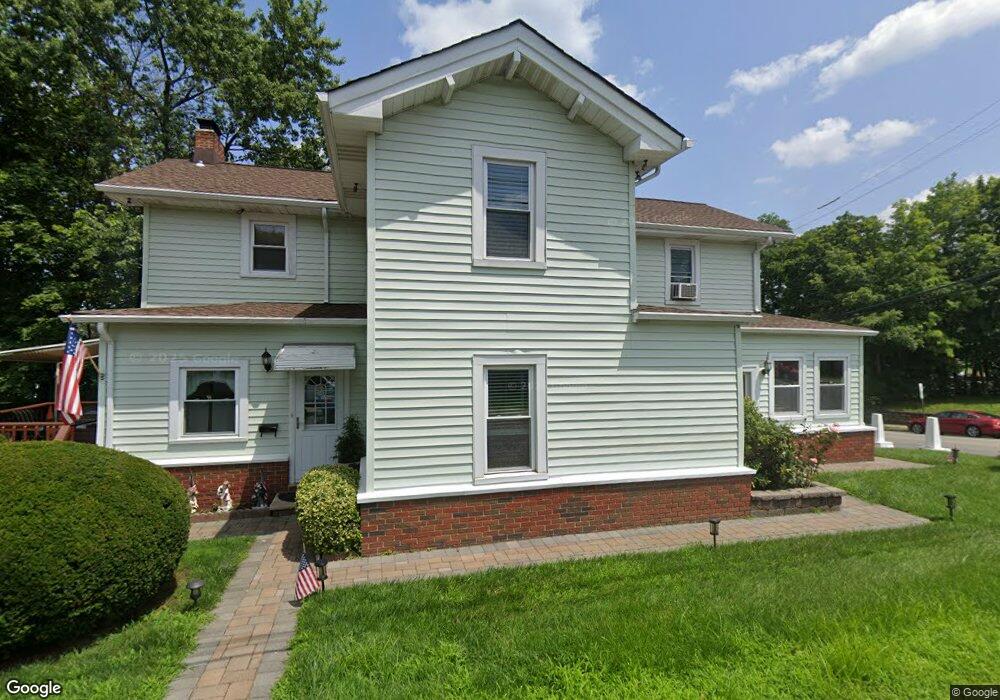
This home is located at 21 Orchard St, Dover, NJ 07801 and is currently estimated at $510,065, approximately $236 per square foot. 21 Orchard St is a home located in Morris County with nearby schools including Dover Middle School and Dover High School.
Ownership History
Date
Name
Owned For
Owner Type
Purchase Details
Closed on
Jul 10, 2021
Sold by
Santarlas Brien and Santarlas Rachel
Bought by
Pin Wei Chen And Grace Chen 1993 Inter Vivos
Current Estimated Value
Purchase Details
Closed on
Jan 6, 2005
Sold by
Alfonso Eulalia
Bought by
Aguirre Luis and Aguirre Elizabeth
Home Financials for this Owner
Home Financials are based on the most recent Mortgage that was taken out on this home.
Original Mortgage
$231,200
Interest Rate
5.71%
Mortgage Type
New Conventional
Create a Home Valuation Report for This Property
The Home Valuation Report is an in-depth analysis detailing your home's value as well as a comparison with similar homes in the area
Home Values in the Area
Average Home Value in this Area
Purchase History
| Date | Buyer | Sale Price | Title Company |
|---|---|---|---|
| Pin Wei Chen And Grace Chen 1993 Inter Vivos | $2,405,000 | Stone-Dougherty Rosemary | |
| Aguirre Luis | $272,000 | -- |
Source: Public Records
Mortgage History
| Date | Status | Borrower | Loan Amount |
|---|---|---|---|
| Previous Owner | Aguirre Luis | $231,200 |
Source: Public Records
Tax History Compared to Growth
Tax History
| Year | Tax Paid | Tax Assessment Tax Assessment Total Assessment is a certain percentage of the fair market value that is determined by local assessors to be the total taxable value of land and additions on the property. | Land | Improvement |
|---|---|---|---|---|
| 2025 | $8,454 | $258,300 | $87,600 | $170,700 |
| 2024 | $8,155 | $258,300 | $87,600 | $170,700 |
| 2023 | $8,155 | $258,300 | $87,600 | $170,700 |
| 2022 | $7,498 | $258,300 | $87,600 | $170,700 |
| 2021 | $7,498 | $258,300 | $87,600 | $170,700 |
| 2020 | $7,349 | $258,300 | $87,600 | $170,700 |
| 2019 | $7,044 | $258,300 | $87,600 | $170,700 |
| 2018 | $6,656 | $258,300 | $87,600 | $170,700 |
| 2017 | $6,354 | $258,300 | $87,600 | $170,700 |
| 2016 | $6,204 | $258,300 | $87,600 | $170,700 |
| 2015 | $6,749 | $328,400 | $128,200 | $200,200 |
| 2014 | $6,680 | $328,400 | $128,200 | $200,200 |
Source: Public Records
Map
Nearby Homes
- 51 N Morris St
- 142 W Blackwell St
- 60 A E Black Well St
- 48 Byram Ave
- 104 Jordan Terrace
- 11 Front St
- 68 Grant St
- 52 Central Ave
- 121 W Clinton St
- 37 1st St
- 24 Livingston Ave
- 4 Park Heights Ave
- 41 Livingston Ave
- 164 E Blackwell St Unit 166
- 61 W Munson Ave
- 191 E Blackwell St Abcd
- 203 E Black Well St Abc Unit ABC
- 207 E Blackwell St
- 301 W Blackwell St Unit 2
- 126 Baker St
- 107-105 Berry
- 10 Legion Place
- 28 Orchard St
- 24 Orchard St
- 22 Orchard St
- 41 Orchard St
- 34 Orchard St
- 43 Orchard St
- 38 Orchard St
- 44 Orchard St Unit A,B,C
- 44 Orchard St
- 48 W Blackwell St
- 1 W Dickerson St
- 1 W Dickerson St
- 6 S Warren St Unit 102
- 34 Chestnut St
- 16 W Blackwell St Unit A
- 16 W Blackwell St Unit E
- 16 W Blackwell St Unit 8
- 16 W Blackwell St Unit 201D