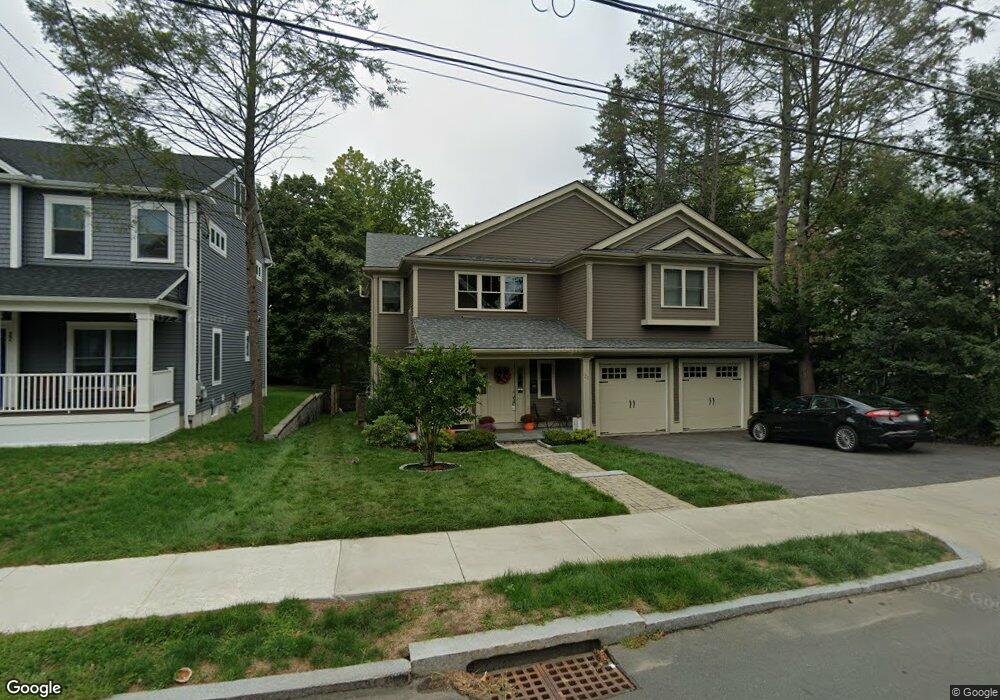
21 Orris St Auburndale, MA 02466
Auburndale NeighborhoodEstimated Value: $2,242,950 - $2,726,000
4
Beds
5
Baths
3,211
Sq Ft
$747/Sq Ft
Est. Value
About This Home
This home is located at 21 Orris St, Auburndale, MA 02466 and is currently estimated at $2,398,988, approximately $747 per square foot. 21 Orris St is a home located in Middlesex County with nearby schools including C.C. Burr, F.A. Day Middle School, and Newton North High School.
Ownership History
Date
Name
Owned For
Owner Type
Purchase Details
Closed on
May 18, 2016
Sold by
Sunset Realty Llc
Bought by
Charles M M Jacobs T
Current Estimated Value
Purchase Details
Closed on
Dec 16, 2014
Sold by
Loftus Ann M Est
Bought by
Sunset Realty Llc
Home Financials for this Owner
Home Financials are based on the most recent Mortgage that was taken out on this home.
Original Mortgage
$950,000
Interest Rate
3.98%
Mortgage Type
Purchase Money Mortgage
Purchase Details
Closed on
Nov 20, 2000
Sold by
Mccarthy John E
Bought by
Loftus Ann M
Home Financials for this Owner
Home Financials are based on the most recent Mortgage that was taken out on this home.
Original Mortgage
$202,500
Interest Rate
7.78%
Mortgage Type
Purchase Money Mortgage
Create a Home Valuation Report for This Property
The Home Valuation Report is an in-depth analysis detailing your home's value as well as a comparison with similar homes in the area
Home Values in the Area
Average Home Value in this Area
Purchase History
| Date | Buyer | Sale Price | Title Company |
|---|---|---|---|
| Charles M M Jacobs T | $1,500,000 | -- | |
| Sunset Realty Llc | $500,000 | -- | |
| Loftus Ann M | $270,000 | -- |
Source: Public Records
Mortgage History
| Date | Status | Borrower | Loan Amount |
|---|---|---|---|
| Previous Owner | Sunset Realty Llc | $950,000 | |
| Previous Owner | Loftus Ann M | $186,830 | |
| Previous Owner | Loftus Ann M | $202,500 |
Source: Public Records
Tax History
| Year | Tax Paid | Tax Assessment Tax Assessment Total Assessment is a certain percentage of the fair market value that is determined by local assessors to be the total taxable value of land and additions on the property. | Land | Improvement |
|---|---|---|---|---|
| 2025 | $20,355 | $2,077,000 | $931,000 | $1,146,000 |
| 2024 | $19,681 | $2,016,500 | $903,900 | $1,112,600 |
| 2023 | $19,015 | $1,867,900 | $691,400 | $1,176,500 |
| 2022 | $18,194 | $1,729,500 | $640,200 | $1,089,300 |
| 2021 | $17,556 | $1,631,600 | $604,000 | $1,027,600 |
| 2020 | $17,034 | $1,631,600 | $604,000 | $1,027,600 |
| 2019 | $16,554 | $1,584,100 | $586,400 | $997,700 |
| 2018 | $16,055 | $1,483,800 | $528,700 | $955,100 |
| 2017 | $10,233 | $920,200 | $498,800 | $421,400 |
| 2016 | $4,932 | $433,400 | $0 | $0 |
| 2015 | $3,998 | $344,400 | $344,400 | $0 |
Source: Public Records
Map
Nearby Homes
- 49 Staniford St
- 160 Pine St Unit 15
- 160 Pine St Unit 12
- 232 Melrose St Unit 2
- 305 Webster St Unit 2
- 10 Higgins St
- 101-103 Lexington St
- 283 Melrose St
- 226 Auburn St Unit 226
- 194 Auburn St
- 1919 Commonwealth Ave Unit 1919
- 1917 Commonwealth Ave Unit 1917
- 2202 Commonwealth Ave Unit 1
- 7 Sharon Ave Unit 7
- 74 Rumford Ave
- 214 River St Unit 214
- 24 Mague Ave Unit 24
- 0 Duncan Rd Unit 72925240
- 105 Adams Ave
- 17 Lasell St
Your Personal Tour Guide
Ask me questions while you tour the home.