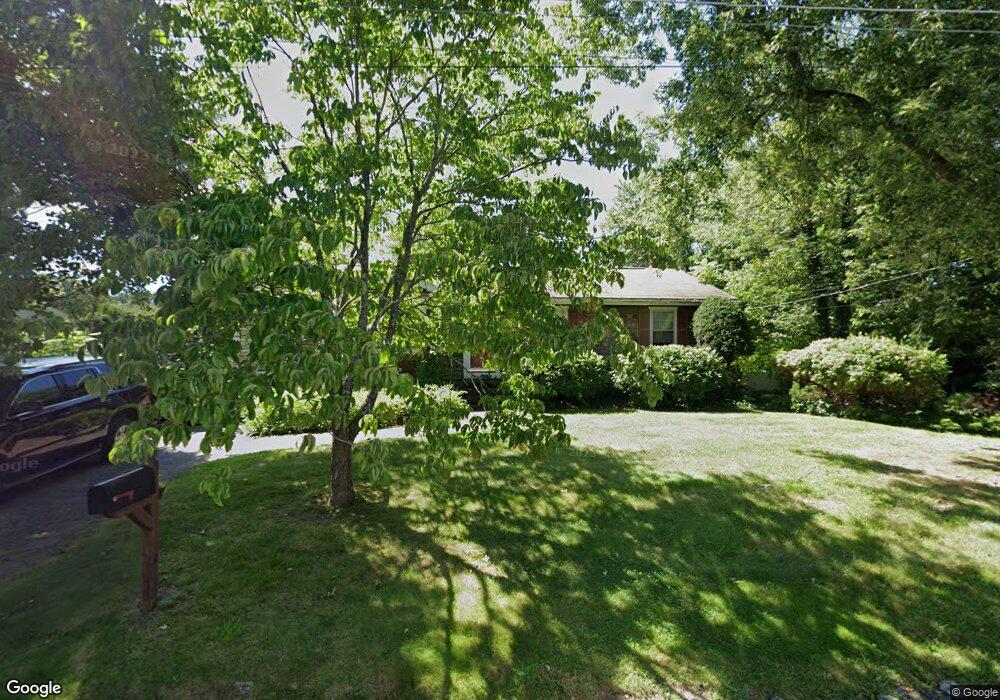
21 Oswego St Bellingham, MA 02019
Estimated Value: $468,473 - $546,000
3
Beds
1
Bath
1,701
Sq Ft
$299/Sq Ft
Est. Value
About This Home
This home is located at 21 Oswego St, Bellingham, MA 02019 and is currently estimated at $509,118, approximately $299 per square foot. 21 Oswego St is a home located in Norfolk County with nearby schools including Joseph F. DiPietro Elementary, Bellingham High School, and Rise Prep Mayoral Academy Middle School.
Ownership History
Date
Name
Owned For
Owner Type
Purchase Details
Closed on
Sep 29, 2017
Sold by
Murphy Liam M and Murphy Lou A
Bought by
Murphy Liam M
Current Estimated Value
Purchase Details
Closed on
Apr 28, 1994
Sold by
Langubrand Robert R and Langubrand Helen J
Bought by
Murphy Liam M
Home Financials for this Owner
Home Financials are based on the most recent Mortgage that was taken out on this home.
Original Mortgage
$122,000
Interest Rate
7.7%
Mortgage Type
Purchase Money Mortgage
Create a Home Valuation Report for This Property
The Home Valuation Report is an in-depth analysis detailing your home's value as well as a comparison with similar homes in the area
Home Values in the Area
Average Home Value in this Area
Purchase History
| Date | Buyer | Sale Price | Title Company |
|---|---|---|---|
| Murphy Liam M | -- | -- | |
| Murphy Liam M | $128,500 | -- | |
| Murphy Liam M | $128,500 | -- |
Source: Public Records
Mortgage History
| Date | Status | Borrower | Loan Amount |
|---|---|---|---|
| Previous Owner | Murphy Liam M | $122,000 | |
| Previous Owner | Murphy Liam M | $20,000 |
Source: Public Records
Tax History
| Year | Tax Paid | Tax Assessment Tax Assessment Total Assessment is a certain percentage of the fair market value that is determined by local assessors to be the total taxable value of land and additions on the property. | Land | Improvement |
|---|---|---|---|---|
| 2025 | $4,819 | $383,700 | $165,200 | $218,500 |
| 2024 | $4,627 | $359,800 | $150,800 | $209,000 |
| 2023 | $4,460 | $341,800 | $143,700 | $198,100 |
| 2022 | $4,341 | $308,300 | $119,800 | $188,500 |
| 2021 | $4,232 | $293,700 | $119,800 | $173,900 |
| 2020 | $3,984 | $280,200 | $119,800 | $160,400 |
| 2019 | $3,899 | $274,400 | $119,800 | $154,600 |
| 2018 | $3,613 | $250,700 | $115,200 | $135,500 |
| 2017 | $3,515 | $245,100 | $115,200 | $129,900 |
| 2016 | $3,358 | $235,000 | $113,200 | $121,800 |
| 2015 | $3,221 | $226,000 | $108,900 | $117,100 |
| 2014 | $3,224 | $219,900 | $106,400 | $113,500 |
Source: Public Records
Map
Nearby Homes
- 70 Oswego St
- 90 Pleasant St
- 60 Freeman St
- 21 Irving St
- 101 Pine Grove Ave
- 82 Paine St
- Lot 2 Pulaski Blvd
- 22 Fox Run Rd
- 194 Paine St
- 13 Ethel St
- 40 Valley St
- Lot 3 Pickering Rd
- Lot 2 Pickering Rd
- Lot 1 Pickering Rd
- Lot 5 Pickering Rd
- Lot 4 Pickering Rd
- 202 Paine St
- 178 Saint Louis Ave
- 188 Saint Louis Ave
- 1088 Diamond Hill Rd
Your Personal Tour Guide
Ask me questions while you tour the home.