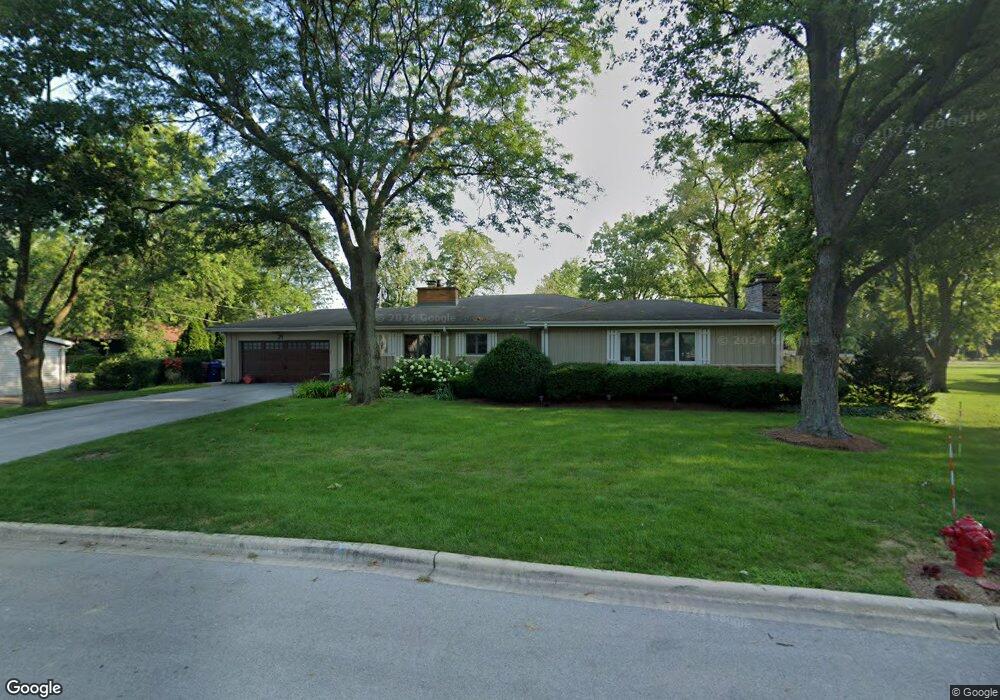
21 Pacific St Frankfort, IL 60423
North Frankfort NeighborhoodEstimated Value: $459,000 - $589,000
4
Beds
2
Baths
2,210
Sq Ft
$235/Sq Ft
Est. Value
About This Home
This home is located at 21 Pacific St, Frankfort, IL 60423 and is currently estimated at $520,293, approximately $235 per square foot. 21 Pacific St is a home located in Will County with nearby schools including Grand Prairie Elementary School, Chelsea Intermediate School, and Hickory Creek Middle School.
Ownership History
Date
Name
Owned For
Owner Type
Purchase Details
Closed on
Jan 14, 2025
Sold by
Weber Matthew H and Weber Nicole
Bought by
Weber Matthew H and Weber Nicole
Current Estimated Value
Home Financials for this Owner
Home Financials are based on the most recent Mortgage that was taken out on this home.
Original Mortgage
$378,555
Outstanding Balance
$376,143
Interest Rate
9.34%
Mortgage Type
Credit Line Revolving
Estimated Equity
$144,150
Purchase Details
Closed on
Oct 7, 2014
Sold by
Cleveland Rebecca J and Swinton Susan G
Bought by
Weber Matthew and Weber Nicole
Home Financials for this Owner
Home Financials are based on the most recent Mortgage that was taken out on this home.
Original Mortgage
$312,550
Interest Rate
4.5%
Mortgage Type
New Conventional
Purchase Details
Closed on
Dec 22, 2004
Sold by
Dralle Ralph D and Will Of Phyllis A Dralle
Bought by
Dralle Ralph D and Phyllis A Dralle Trust
Create a Home Valuation Report for This Property
The Home Valuation Report is an in-depth analysis detailing your home's value as well as a comparison with similar homes in the area
Home Values in the Area
Average Home Value in this Area
Purchase History
| Date | Buyer | Sale Price | Title Company |
|---|---|---|---|
| Weber Matthew H | -- | Netco Title | |
| Weber Matthew | $329,000 | Fidelity National Title | |
| Dralle Ralph D | -- | None Available | |
| Dralle Ralph D | -- | None Available | |
| Dralle Ralph D | -- | None Available |
Source: Public Records
Mortgage History
| Date | Status | Borrower | Loan Amount |
|---|---|---|---|
| Open | Weber Matthew H | $378,555 | |
| Previous Owner | Weber Matthew | $312,550 |
Source: Public Records
Tax History
| Year | Tax Paid | Tax Assessment Tax Assessment Total Assessment is a certain percentage of the fair market value that is determined by local assessors to be the total taxable value of land and additions on the property. | Land | Improvement |
|---|---|---|---|---|
| 2024 | $11,933 | $168,615 | $36,356 | $132,259 |
| 2023 | $11,933 | $166,022 | $32,469 | $133,553 |
| 2022 | $11,476 | $141,218 | $29,574 | $111,644 |
| 2021 | $10,823 | $132,116 | $27,668 | $104,448 |
| 2020 | $10,556 | $128,392 | $26,888 | $101,504 |
| 2019 | $10,218 | $124,955 | $26,168 | $98,787 |
| 2018 | $10,037 | $121,363 | $25,416 | $95,947 |
| 2017 | $10,031 | $118,530 | $24,823 | $93,707 |
| 2016 | $9,797 | $114,466 | $23,972 | $90,494 |
| 2015 | $6,463 | $110,435 | $23,128 | $87,307 |
| 2014 | $6,463 | $82,023 | $22,967 | $59,056 |
| 2013 | $6,463 | $83,087 | $23,265 | $59,822 |
Source: Public Records
Map
Nearby Homes
- 120 W Sauk Trail
- 111 Oak St
- 115 Center Rd
- Lot 3 Town Center Dr
- 51 Kaffel Ct
- 21629 Kent Ct
- 9736 Folkers Dr
- 9730 Folkers Dr
- 9724 Folkers Dr
- 376 Nevada a Ct
- Lot 2 W Laraway Rd
- 21726 Higley Ln
- 21702 Higley Ln
- 9815 W Laraway Rd
- 254 Willow St
- 480 Nebraska b Ct
- 8969 Charrington Dr
- 9155 Arbour Walk Dr
- 647 Johnson Ave
- 21377 Bramble Dr
Your Personal Tour Guide
Ask me questions while you tour the home.