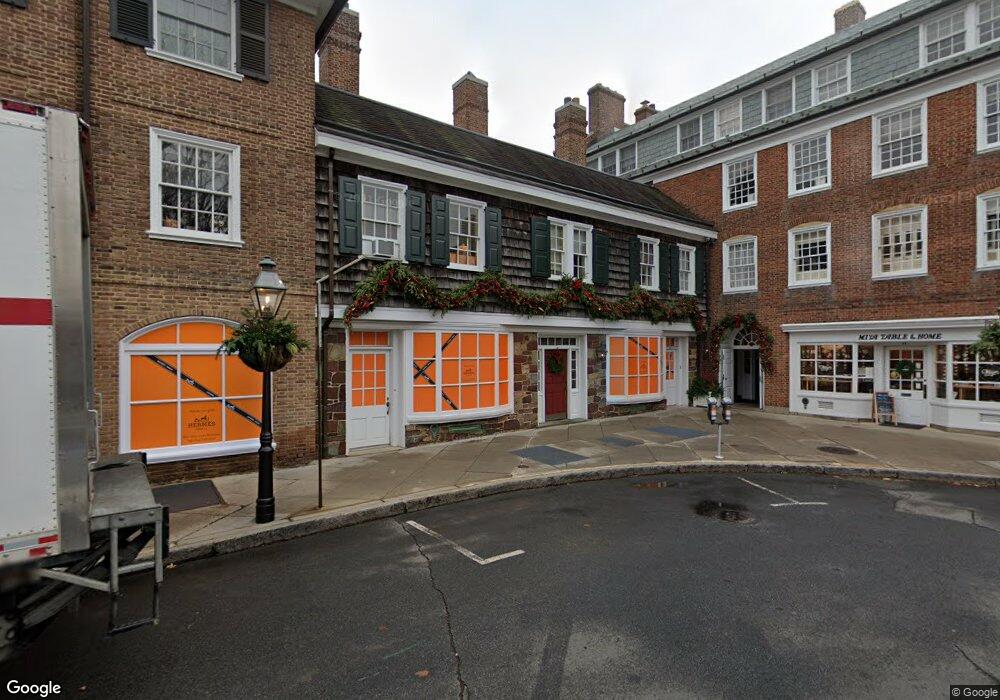
21 Palmer Square W Princeton, NJ 08542
Estimated Value: $381,000 - $388,000
--
Bed
--
Bath
250
Sq Ft
$1,538/Sq Ft
Est. Value
About This Home
The location of this property can't be beat with all of downtown Princeton's restaurants and shops at your doorstep. The windows look out over Palmer Square, the buzzing center of downtown Princeton. Also just a few steps from Princeton University campus.
Ownership History
Date
Name
Owned For
Owner Type
Purchase Details
Closed on
May 23, 2023
Sold by
Chang Chinhsi and Chang Syhsien
Bought by
Tirandaz Maryam and Zhou Hai
Current Estimated Value
Purchase Details
Closed on
Jul 21, 2021
Sold by
Hwang Jasper
Bought by
Chang Chinhsi and Chang Syhsien
Purchase Details
Closed on
Dec 22, 2015
Sold by
Hwang Jasper and Riggs Amy
Bought by
Hwang Jasper
Purchase Details
Closed on
Nov 18, 2010
Sold by
Olentine Cynthia A and Olentine Stephen P
Bought by
Hwang Jasper and Hwang Amy
Purchase Details
Closed on
Nov 18, 1999
Sold by
Wilson Barry
Bought by
Shaffer Neal and Shaffer Deborah
Home Financials for this Owner
Home Financials are based on the most recent Mortgage that was taken out on this home.
Original Mortgage
$75,000
Interest Rate
7.73%
Create a Home Valuation Report for This Property
The Home Valuation Report is an in-depth analysis detailing your home's value as well as a comparison with similar homes in the area
Home Values in the Area
Average Home Value in this Area
Purchase History
| Date | Buyer | Sale Price | Title Company |
|---|---|---|---|
| Tirandaz Maryam | $350,000 | Title Authority | |
| Chang Chinhsi | $285,000 | None Available | |
| Hwang Jasper | -- | Commonwealth Land Title Ins | |
| Hwang Jasper | $240,000 | Commonwealth Land Title Insu | |
| Shaffer Neal | $79,000 | -- |
Source: Public Records
Mortgage History
| Date | Status | Borrower | Loan Amount |
|---|---|---|---|
| Previous Owner | Shaffer Neal | $75,000 |
Source: Public Records
Property History
| Date | Event | Price | List to Sale | Price per Sq Ft |
|---|---|---|---|---|
| 09/05/2024 09/05/24 | For Rent | $2,350 | -- | -- |
Tax History Compared to Growth
Tax History
| Year | Tax Paid | Tax Assessment Tax Assessment Total Assessment is a certain percentage of the fair market value that is determined by local assessors to be the total taxable value of land and additions on the property. | Land | Improvement |
|---|---|---|---|---|
| 2025 | $5,912 | $222,000 | $168,000 | $54,000 |
| 2024 | $5,581 | $222,000 | $168,000 | $54,000 |
| 2023 | $5,581 | $222,000 | $168,000 | $54,000 |
| 2022 | $5,399 | $222,000 | $168,000 | $54,000 |
| 2021 | $5,415 | $222,000 | $168,000 | $54,000 |
| 2020 | $5,372 | $222,000 | $168,000 | $54,000 |
| 2019 | $5,266 | $222,000 | $168,000 | $54,000 |
| 2018 | $5,177 | $222,000 | $168,000 | $54,000 |
| 2017 | $5,106 | $222,000 | $168,000 | $54,000 |
| 2016 | $5,026 | $222,000 | $168,000 | $54,000 |
| 2015 | $4,911 | $222,000 | $168,000 | $54,000 |
| 2014 | $4,221 | $193,200 | $139,200 | $54,000 |
Source: Public Records
Map
Nearby Homes
- 48 Nassau St Unit I
- 49 Palmer Square W Unit D
- 20 Paul Robeson Place
- 722 Avery Ln
- 721 Avery Ln
- 98 Nassau St Unit 3
- 54 Hodge Rd
- 44 Park Place Unit 1
- 87 Library Place
- 36 Moore St Unit 6
- 176 Bayard Ln
- 29 Chestnut St
- 240 Library Place
- 188 Bayard Ln
- 192 Bayard Ln
- 189 Moore St
- 95 Westcott Rd
- 155 Hodge Rd
- 22 Valley Rd
- 22 Gordon Way
- 21 Palmer Square W Unit D
- 21 Palmer Square W Unit C
- 21 Palmer Square W Unit B
- 21 Palmer Square W Unit A
- 48 Nassau St Unit J
- 48 Nassau St Unit F
- 48 Nassau St Unit H
- 48 Nassau St Unit G
- 48 Nassau St Unit E
- 48 Nassau St Unit D
- 48 Nassau St Unit C
- 48 Nassau St Unit B
- 48 Nassau St Unit A
- 43 Palmer Square W Unit 43F
- 43 Palmer Square W Unit F
- 43 Palmer Square W Unit B
- 43 Palmer Square W Unit C
- 43 Palmer Square W Unit E
- 43 Palmer Square W Unit A
- 43 Palmer Square W Unit D