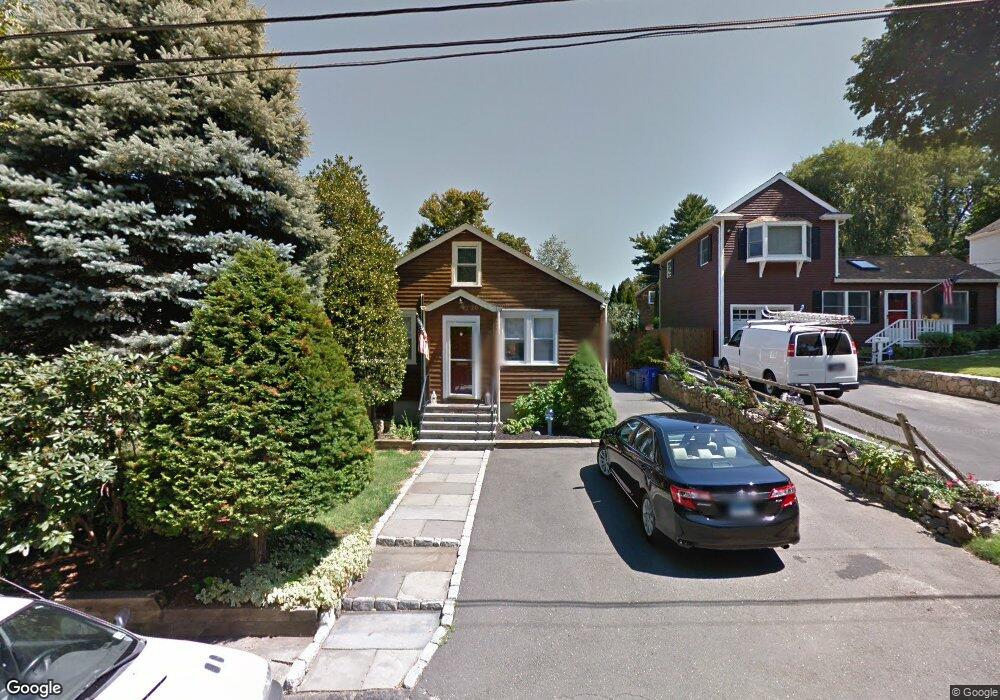
21 Parallel St Norwalk, CT 06850
Spring Hill NeighborhoodEstimated Value: $562,000 - $609,000
2
Beds
2
Baths
1,293
Sq Ft
$461/Sq Ft
Est. Value
About This Home
This home is located at 21 Parallel St, Norwalk, CT 06850 and is currently estimated at $595,592, approximately $460 per square foot. 21 Parallel St is a home located in Fairfield County with nearby schools including Kendall Elementary School, Ponus Ridge Middle School, and Brien Mcmahon High School.
Ownership History
Date
Name
Owned For
Owner Type
Purchase Details
Closed on
Oct 10, 2025
Sold by
Viesti Lisa
Bought by
Lisa Viesti Irt and Sibilio
Current Estimated Value
Purchase Details
Closed on
Aug 23, 2011
Sold by
Herianto-Syah Yuli and Janensch Laurel A
Bought by
Viesti Lisa
Home Financials for this Owner
Home Financials are based on the most recent Mortgage that was taken out on this home.
Original Mortgage
$287,850
Interest Rate
4.62%
Mortgage Type
FHA
Purchase Details
Closed on
Sep 24, 2003
Sold by
Lopez David J and Lopez Debra R
Bought by
Janensch Syah Laurel A and Syah Yuli Herianto
Purchase Details
Closed on
Feb 16, 2001
Sold by
Winter Edward J and Winter Jessica
Bought by
Lopez David and Lopez Debra
Purchase Details
Closed on
Oct 30, 1998
Sold by
Migliaccio Edward
Bought by
Winter Edward J and Winter Jessice
Purchase Details
Closed on
Dec 30, 1991
Sold by
Sideleau John and Sideleau Lucie
Bought by
Migliaccio Edward
Create a Home Valuation Report for This Property
The Home Valuation Report is an in-depth analysis detailing your home's value as well as a comparison with similar homes in the area
Home Values in the Area
Average Home Value in this Area
Purchase History
| Date | Buyer | Sale Price | Title Company |
|---|---|---|---|
| Lisa Viesti Irt | -- | -- | |
| Viesti Lisa | $315,000 | -- | |
| Viesti Lisa | $315,000 | -- | |
| Janensch Syah Laurel A | $336,000 | -- | |
| Janensch Syah Laurel A | $336,000 | -- | |
| Lopez David | $249,500 | -- | |
| Lopez David | $249,500 | -- | |
| Winter Edward J | $188,500 | -- | |
| Winter Edward J | $188,500 | -- | |
| Migliaccio Edward | $162,000 | -- |
Source: Public Records
Mortgage History
| Date | Status | Borrower | Loan Amount |
|---|---|---|---|
| Previous Owner | Migliaccio Edward | $287,785 | |
| Previous Owner | Migliaccio Edward | $287,850 |
Source: Public Records
Tax History
| Year | Tax Paid | Tax Assessment Tax Assessment Total Assessment is a certain percentage of the fair market value that is determined by local assessors to be the total taxable value of land and additions on the property. | Land | Improvement |
|---|---|---|---|---|
| 2025 | $7,722 | $322,470 | $149,030 | $173,440 |
| 2024 | $7,607 | $322,470 | $149,030 | $173,440 |
| 2023 | $5,853 | $232,620 | $109,280 | $123,340 |
| 2022 | $5,744 | $232,620 | $109,280 | $123,340 |
| 2021 | $5,595 | $232,620 | $109,280 | $123,340 |
| 2020 | $5,591 | $232,620 | $109,280 | $123,340 |
| 2019 | $5,435 | $232,620 | $109,280 | $123,340 |
| 2018 | $5,315 | $199,330 | $113,340 | $85,990 |
| 2017 | $5,132 | $199,320 | $113,340 | $85,980 |
| 2016 | $5,083 | $199,330 | $113,340 | $85,990 |
| 2015 | $5,069 | $199,330 | $113,340 | $85,990 |
| 2014 | $5,003 | $199,330 | $113,340 | $85,990 |
Source: Public Records
Map
Nearby Homes
- 5 Tower Dr
- 5 Lakeview Dr
- 48 Fair St
- 17 Silk St
- 80 Broad St
- 4 Hill Ct Unit B
- 16 Cornwall Rd
- 10 Slocum St
- 150 Fillow St
- 115 Fillow St Unit 78
- 15 Spring Hill Ave
- 2 Leuvine St Unit 1
- 153 Fillow St
- 16 Grandview Ave
- 12 Sention Ave
- 10 Prospect Ave Unit 8
- 403 Silver Creek Ln
- 18 Prospect Ave Unit B1
- 50 Aiken St Unit 253
- 26 Prospect Ave Unit F4
- 23 Parallel St
- 19 Parallel St
- 17 Parallel St
- 122 Spring Hill Ave
- 124 Spring Hill Ave
- 118 Spring Hill Ave
- 20 Parallel St
- 15 Parallel St
- 18 Parallel St
- 25 Parallel St
- 16 Parallel St
- 116 Spring Hill Ave
- 126 Spring Hill Ave
- 13 Parallel St
- 24 Parallel St
- 27 Parallel St
- 114 Spring Hill Ave
- 1 Cavanaugh St
- 1 Ponus Ave
Your Personal Tour Guide
Ask me questions while you tour the home.