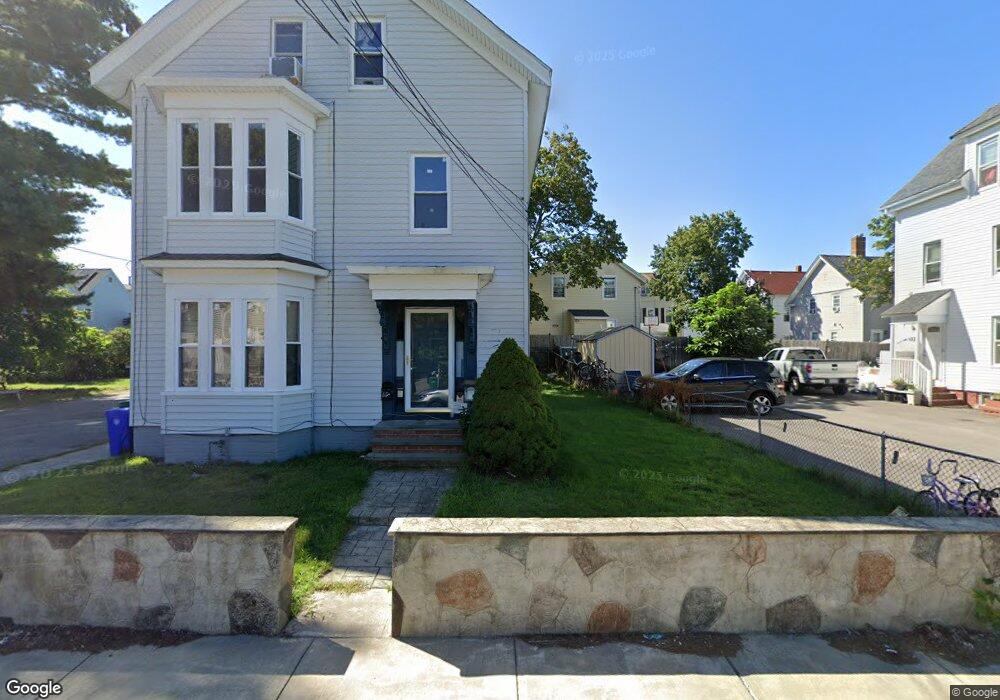
21 Parker St Attleboro, MA 02703
Estimated Value: $396,000 - $629,000
6
Beds
2
Baths
2,239
Sq Ft
$230/Sq Ft
Est. Value
About This Home
This home is located at 21 Parker St, Attleboro, MA 02703 and is currently estimated at $514,826, approximately $229 per square foot. 21 Parker St is a home located in Bristol County with nearby schools including Hyman Fine Elementary School, Wamsutta Middle School, and Attleboro High School.
Ownership History
Date
Name
Owned For
Owner Type
Purchase Details
Closed on
May 4, 1993
Sold by
Skelly Bernard G
Bought by
Bg Rt
Current Estimated Value
Purchase Details
Closed on
Jan 1, 1985
Bought by
Marroquin Jorge A and Marroquin Carmen
Create a Home Valuation Report for This Property
The Home Valuation Report is an in-depth analysis detailing your home's value as well as a comparison with similar homes in the area
Home Values in the Area
Average Home Value in this Area
Purchase History
| Date | Buyer | Sale Price | Title Company |
|---|---|---|---|
| Bg Rt | $70,000 | -- | |
| Bg Rt | $70,000 | -- | |
| Marroquin Jorge A | -- | -- |
Source: Public Records
Mortgage History
| Date | Status | Borrower | Loan Amount |
|---|---|---|---|
| Open | Marroquin Jorge A | $87,000 | |
| Closed | Marroquin Jorge A | $79,000 | |
| Closed | Marroquin Jorge A | $70,000 |
Source: Public Records
Tax History Compared to Growth
Tax History
| Year | Tax Paid | Tax Assessment Tax Assessment Total Assessment is a certain percentage of the fair market value that is determined by local assessors to be the total taxable value of land and additions on the property. | Land | Improvement |
|---|---|---|---|---|
| 2025 | $4,989 | $397,500 | $130,000 | $267,500 |
| 2024 | $4,668 | $366,700 | $130,000 | $236,700 |
| 2023 | $4,562 | $333,200 | $118,100 | $215,100 |
| 2022 | $4,371 | $302,500 | $112,400 | $190,100 |
| 2021 | $6,166 | $279,100 | $108,200 | $170,900 |
| 2020 | $3,818 | $262,200 | $105,100 | $157,100 |
| 2019 | $3,448 | $243,500 | $103,200 | $140,300 |
| 2018 | $3,303 | $222,900 | $100,200 | $122,700 |
| 2017 | $5,067 | $219,000 | $100,200 | $118,800 |
| 2016 | $2,994 | $202,000 | $93,500 | $108,500 |
| 2015 | $2,764 | $187,900 | $93,500 | $94,400 |
| 2014 | $2,499 | $168,300 | $88,600 | $79,700 |
Source: Public Records
Map
Nearby Homes