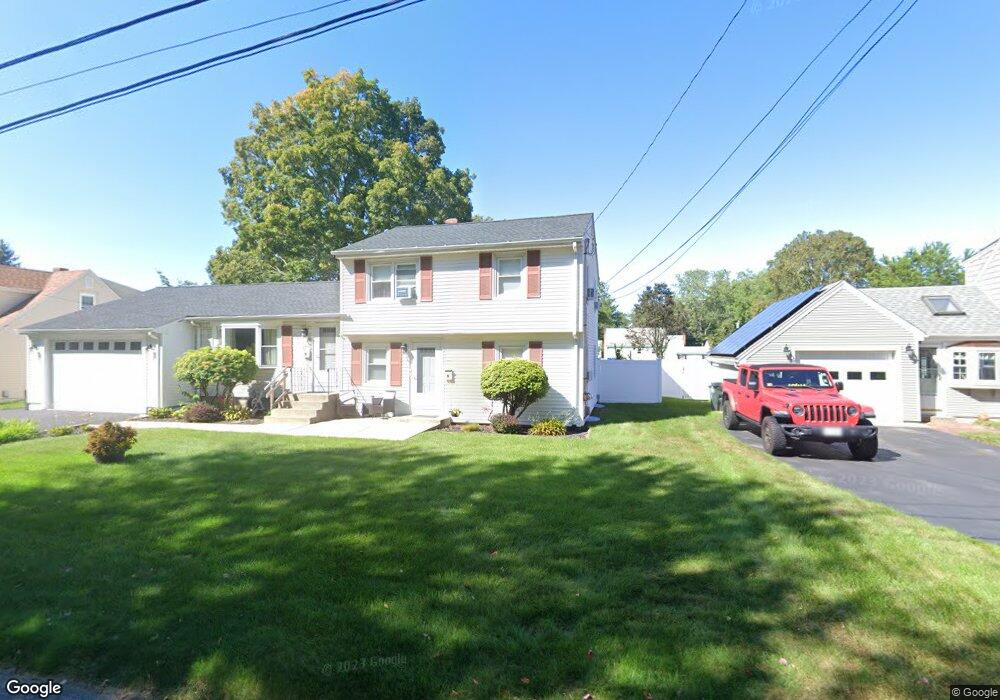
21 Peach Orchard Dr Unit 23 Riverside, RI 02915
Riverside NeighborhoodEstimated Value: $446,863 - $572,000
4
Beds
2
Baths
3,292
Sq Ft
$152/Sq Ft
Est. Value
About This Home
This home is located at 21 Peach Orchard Dr Unit 23, Riverside, RI 02915 and is currently estimated at $500,466, approximately $152 per square foot. 21 Peach Orchard Dr Unit 23 is a home located in Providence County with nearby schools including East Providence High School, St Luke Elementary School, and Barrington Christian Academy.
Ownership History
Date
Name
Owned For
Owner Type
Purchase Details
Closed on
Jan 27, 2016
Sold by
Brandao Antonio L
Bought by
Brandao Antonio and Brandao Eilleen
Current Estimated Value
Home Financials for this Owner
Home Financials are based on the most recent Mortgage that was taken out on this home.
Original Mortgage
$162,000
Outstanding Balance
$67,905
Interest Rate
3.97%
Mortgage Type
New Conventional
Estimated Equity
$432,561
Purchase Details
Closed on
Apr 8, 2005
Sold by
Andrade Joaquim J and Andrade Linda M
Bought by
Brandao Antonio L
Home Financials for this Owner
Home Financials are based on the most recent Mortgage that was taken out on this home.
Original Mortgage
$262,000
Interest Rate
5.95%
Create a Home Valuation Report for This Property
The Home Valuation Report is an in-depth analysis detailing your home's value as well as a comparison with similar homes in the area
Home Values in the Area
Average Home Value in this Area
Purchase History
| Date | Buyer | Sale Price | Title Company |
|---|---|---|---|
| Brandao Antonio | -- | -- | |
| Brandao Antonio | -- | -- | |
| Brandao Antonio L | $327,500 | -- | |
| Brandao Antonio L | $327,500 | -- |
Source: Public Records
Mortgage History
| Date | Status | Borrower | Loan Amount |
|---|---|---|---|
| Open | Brandao Antonio | $162,000 | |
| Closed | Brandao Antonio L | $162,000 | |
| Previous Owner | Brandao Antonio L | $262,000 | |
| Previous Owner | Brandao Antonio L | $262,000 | |
| Previous Owner | Brandao Antonio L | $32,750 |
Source: Public Records
Tax History Compared to Growth
Tax History
| Year | Tax Paid | Tax Assessment Tax Assessment Total Assessment is a certain percentage of the fair market value that is determined by local assessors to be the total taxable value of land and additions on the property. | Land | Improvement |
|---|---|---|---|---|
| 2025 | $6,441 | $492,800 | $93,800 | $399,000 |
| 2024 | $5,316 | $346,800 | $78,200 | $268,600 |
| 2023 | $5,119 | $346,800 | $78,200 | $268,600 |
| 2022 | $5,441 | $248,900 | $45,800 | $203,100 |
| 2021 | $5,351 | $248,900 | $43,200 | $205,700 |
| 2020 | $4,960 | $240,900 | $43,200 | $197,700 |
| 2019 | $4,759 | $237,700 | $43,200 | $194,500 |
| 2018 | $4,565 | $199,500 | $46,400 | $153,100 |
| 2017 | $4,463 | $199,500 | $46,400 | $153,100 |
| 2016 | $4,441 | $199,500 | $46,400 | $153,100 |
| 2015 | $4,521 | $197,000 | $42,900 | $154,100 |
| 2014 | $4,521 | $197,000 | $42,900 | $154,100 |
Source: Public Records
Map
Nearby Homes
- 17 Peach Orchard Dr
- 25 Peach Orchard Dr
- 13 Peach Orchard Dr
- 75 Pine Crest Dr
- 60 Peach Orchard Dr
- 29 Peach Orchard Dr
- 74 Lindy Ave
- 70 Lindy Ave
- 78 Lindy Ave
- 9 Peach Orchard Dr
- 33 Peach Orchard Dr
- 82 Lindy Ave
- 20 Peach Orchard Dr
- 93 Pine Crest Dr
- 97 Pine Crest Dr
- 111 Pine Crest Dr
- 101 Pine Crest Dr
- 60 Lindy Ave
- 77 Pine Crest Dr
- 88 Lindy Ave