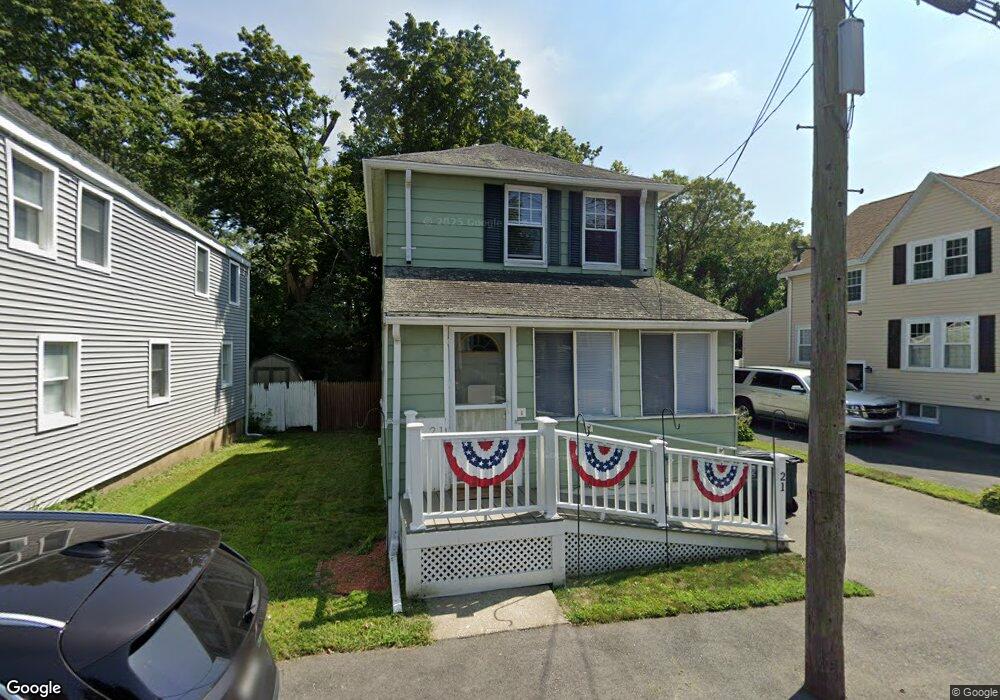
21 Peterson Rd Quincy, MA 02169
Houghs Neck NeighborhoodEstimated Value: $470,831 - $588,000
3
Beds
1
Bath
944
Sq Ft
$566/Sq Ft
Est. Value
About This Home
This home is located at 21 Peterson Rd, Quincy, MA 02169 and is currently estimated at $534,708, approximately $566 per square foot. 21 Peterson Rd is a home located in Norfolk County with nearby schools including Atherton Hough Elementary School, Broad Meadows Middle School, and Quincy High School.
Ownership History
Date
Name
Owned For
Owner Type
Purchase Details
Closed on
Jul 24, 2024
Sold by
Doherty Laura J
Bought by
Doherty Rt and Doherty
Current Estimated Value
Purchase Details
Closed on
Apr 4, 2002
Sold by
Canayan Paul J and Canayan Fiona
Bought by
Doherty Charles W
Home Financials for this Owner
Home Financials are based on the most recent Mortgage that was taken out on this home.
Original Mortgage
$200,000
Interest Rate
6.85%
Mortgage Type
Purchase Money Mortgage
Purchase Details
Closed on
Apr 17, 1992
Sold by
Gomes Clarence Est
Bought by
Canavan Paul J and Canavan Fiona
Home Financials for this Owner
Home Financials are based on the most recent Mortgage that was taken out on this home.
Original Mortgage
$67,500
Interest Rate
8.75%
Mortgage Type
Purchase Money Mortgage
Create a Home Valuation Report for This Property
The Home Valuation Report is an in-depth analysis detailing your home's value as well as a comparison with similar homes in the area
Home Values in the Area
Average Home Value in this Area
Purchase History
| Date | Buyer | Sale Price | Title Company |
|---|---|---|---|
| Doherty Rt | -- | None Available | |
| Doherty Rt | -- | None Available | |
| Doherty Charles W | $239,900 | -- | |
| Doherty Charles W | $239,900 | -- | |
| Canavan Paul J | $90,001 | -- |
Source: Public Records
Mortgage History
| Date | Status | Borrower | Loan Amount |
|---|---|---|---|
| Previous Owner | Doherty Charles W | $200,000 | |
| Previous Owner | Canavan Paul J | $79,600 | |
| Previous Owner | Canavan Paul J | $67,500 | |
| Closed | Canavan Paul J | $15,000 |
Source: Public Records
Tax History Compared to Growth
Tax History
| Year | Tax Paid | Tax Assessment Tax Assessment Total Assessment is a certain percentage of the fair market value that is determined by local assessors to be the total taxable value of land and additions on the property. | Land | Improvement |
|---|---|---|---|---|
| 2025 | $4,530 | $392,900 | $221,900 | $171,000 |
| 2024 | $4,125 | $366,000 | $201,700 | $164,300 |
| 2023 | $3,771 | $338,800 | $183,400 | $155,400 |
| 2022 | $3,684 | $307,500 | $159,500 | $148,000 |
| 2021 | $3,523 | $290,200 | $159,500 | $130,700 |
| 2020 | $3,405 | $273,900 | $159,500 | $114,400 |
| 2019 | $3,272 | $260,700 | $147,600 | $113,100 |
| 2018 | $3,063 | $229,600 | $128,400 | $101,200 |
| 2017 | $3,147 | $222,100 | $128,400 | $93,700 |
| 2016 | $2,945 | $205,100 | $116,700 | $88,400 |
| 2015 | $2,756 | $188,800 | $108,100 | $80,700 |
| 2014 | $2,697 | $181,500 | $108,100 | $73,400 |
Source: Public Records
Map
Nearby Homes