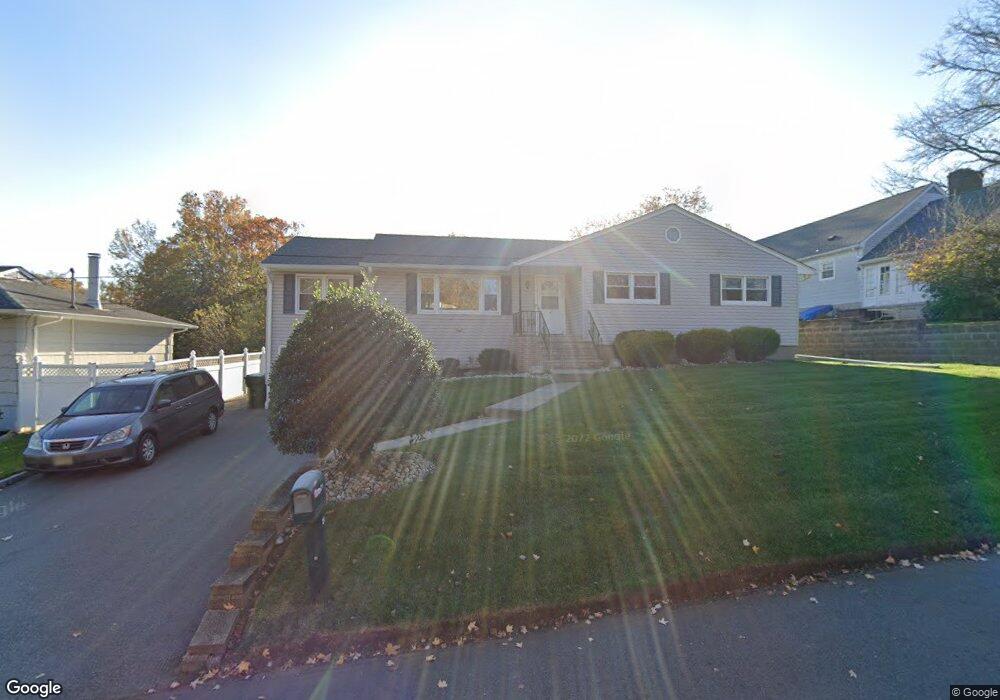
21 Philip St Edison, NJ 08820
Estimated Value: $725,755 - $903,000
3
Beds
3
Baths
1,788
Sq Ft
$462/Sq Ft
Est. Value
About This Home
This home is located at 21 Philip St, Edison, NJ 08820 and is currently estimated at $826,189, approximately $462 per square foot. 21 Philip St is a home located in Middlesex County with nearby schools including Menlo Park Elementary School, Woodrow Wilson Middle School, and J.P. Stevens High School.
Ownership History
Date
Name
Owned For
Owner Type
Purchase Details
Closed on
Jul 29, 2013
Sold by
Thakkar Pankaj C and Thakkar Jaimini P
Bought by
Duddagi Kiran R and Dharmapuri Padmini
Current Estimated Value
Home Financials for this Owner
Home Financials are based on the most recent Mortgage that was taken out on this home.
Original Mortgage
$414,000
Outstanding Balance
$307,261
Interest Rate
4.34%
Mortgage Type
New Conventional
Estimated Equity
$518,928
Create a Home Valuation Report for This Property
The Home Valuation Report is an in-depth analysis detailing your home's value as well as a comparison with similar homes in the area
Home Values in the Area
Average Home Value in this Area
Purchase History
| Date | Buyer | Sale Price | Title Company |
|---|---|---|---|
| Duddagi Kiran R | $460,000 | Commonwealth Land Title Ins |
Source: Public Records
Mortgage History
| Date | Status | Borrower | Loan Amount |
|---|---|---|---|
| Open | Duddagi Kiran R | $414,000 |
Source: Public Records
Tax History
| Year | Tax Paid | Tax Assessment Tax Assessment Total Assessment is a certain percentage of the fair market value that is determined by local assessors to be the total taxable value of land and additions on the property. | Land | Improvement |
|---|---|---|---|---|
| 2025 | $12,102 | $203,300 | $87,500 | $115,800 |
| 2024 | $12,037 | $203,300 | $87,500 | $115,800 |
Source: Public Records
Map
Nearby Homes
- 73 Christie St
- 21 Middlesex Ave
- 22 N Oak Ave
- 24 Maple Rd
- 182 Parsonage Rd
- 9 Holly Rd
- 1610 Oak Tree Rd
- 55 Gill Ln Unit 54
- 55 Gill Ln Unit 31
- 28 Silzer Ave
- 30 Bender Ave
- 34 N Juliet St
- 51 Adams St
- 187 Evergreen Rd Unit 4B
- 199 Evergreen Rd Unit 14A
- 199 Evergreen Rd Unit 8A
- 199 Evergreen Rd Unit 5B
- 182 Evergreen Rd Unit 3B
- 182 Evergreen Rd Unit 3A
- 182 Evergreen Rd Unit 1B
Your Personal Tour Guide
Ask me questions while you tour the home.