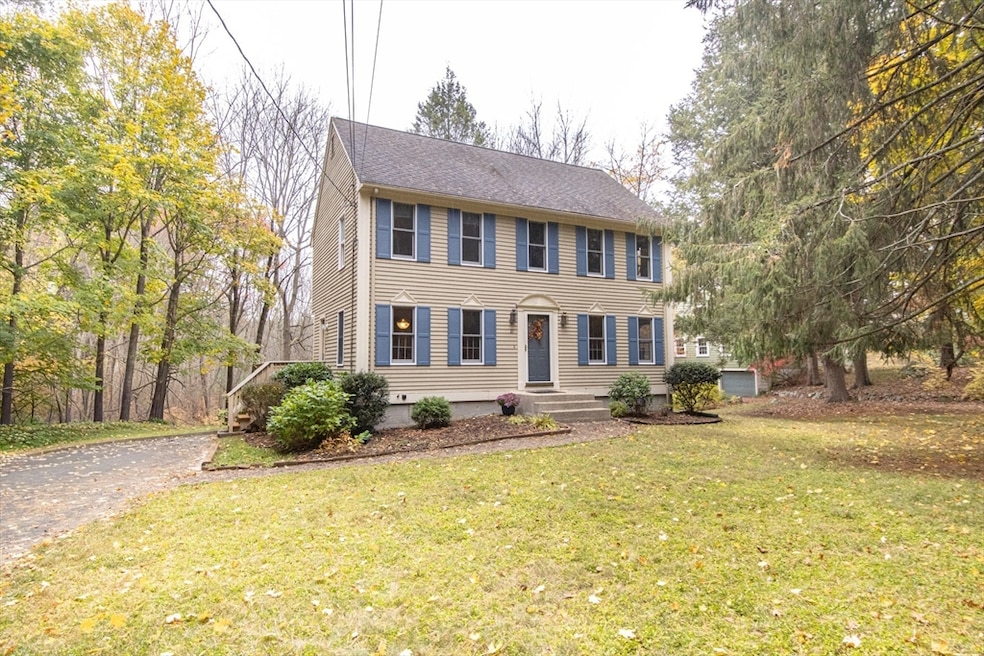
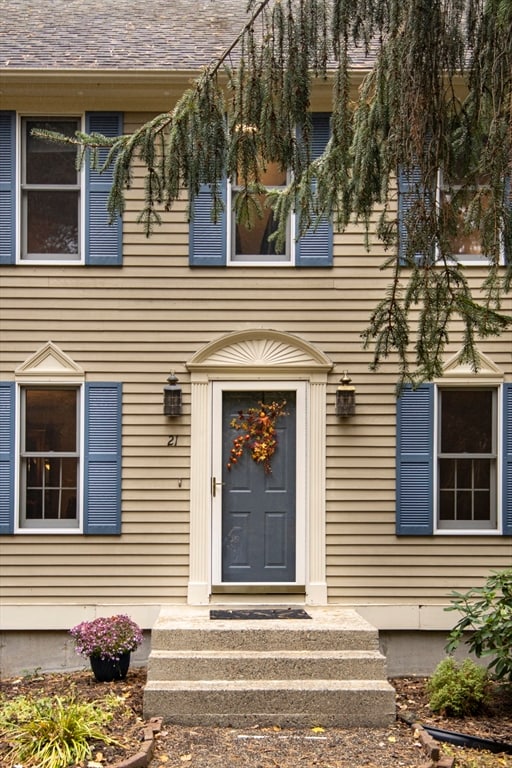
21 Philip St Medfield, MA 02052
Estimated payment $5,252/month
Highlights
- Community Stables
- Scenic Views
- Deck
- Ralph Wheelock School Rated A
- Colonial Architecture
- Wooded Lot
About This Home
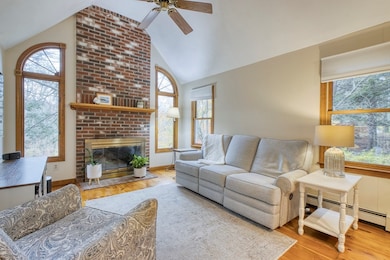
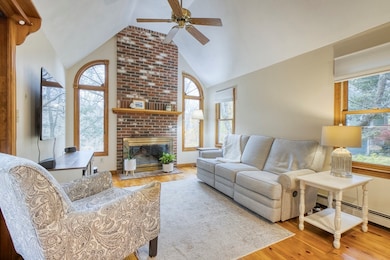
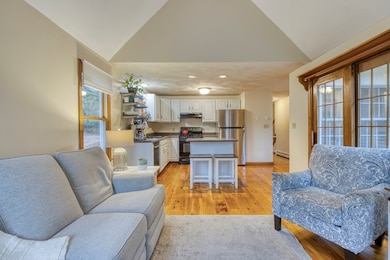
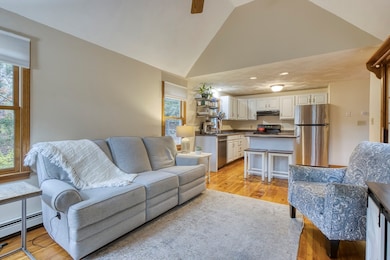
Welcome to this beautifully maintained custom-built home on scenic Philip Street, lovingly owned by the original family since 1991.The great room features picture windows overlooking 18 acres of abutting forested land and a stunning floor-to-ceiling fireplace. Step onto your private back deck to watch the seasons shift and enjoy time with family and friends. A bright front family room with plentiful windows fills the home with natural light, while a classic dining room provides the perfect setting for hosting family and friends. With three spacious bedrooms, 1.5 bathrooms, and additional space for an office and recreation in the finished basement, this home offers comfort and flexibility. Ideally located near Medfield Center’s boutiques, restaurants, and Brother’s Marketplace, as well as Medfield High, Blake Middle, and Wheelock Elementary. Enjoy nearby walking and running paths at the schools’ track and field—an exceptional Medfield opportunity!
Listing Agent
Berkshire Hathaway HomeServices Page Realty Listed on: 10/30/2025

Home Details
Home Type
- Single Family
Est. Annual Taxes
- $10,540
Year Built
- Built in 1991
Lot Details
- 0.53 Acre Lot
- Sprinkler System
- Wooded Lot
- Property is zoned RS
Home Design
- Colonial Architecture
- Frame Construction
- Shingle Roof
- Concrete Perimeter Foundation
Interior Spaces
- 1,548 Sq Ft Home
- 1 Fireplace
- Scenic Vista Views
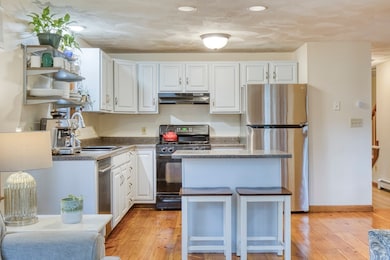
Kitchen
- Range
- Dishwasher
Flooring
- Wood
- Wall to Wall Carpet
- Ceramic Tile
Bedrooms and Bathrooms
- 3 Bedrooms
- Primary bedroom located on second floor
Laundry
- Dryer
- Washer
Partially Finished Basement
- Basement Fills Entire Space Under The House
- Laundry in Basement
Parking
- 5 Car Parking Spaces
- Stone Driveway
- Off-Street Parking
Outdoor Features
- Deck
- Outdoor Storage
Location
- Property is near schools
Schools
- Mem/Wheelock/Dale Elementary School
- Blake Middle School
- Medfield High School
Utilities
- Window Unit Cooling System
- 3 Heating Zones
- Heating System Uses Natural Gas
- Baseboard Heating
Listing and Financial Details
- Assessor Parcel Number M:0038 B:0000 L:0083,113415
Community Details
Overview
- No Home Owners Association
Recreation
- Tennis Courts
- Community Pool
- Park
- Community Stables
- Jogging Path
- Bike Trail
Map
Home Values in the Area
Average Home Value in this Area
Tax History
| Year | Tax Paid | Tax Assessment Tax Assessment Total Assessment is a certain percentage of the fair market value that is determined by local assessors to be the total taxable value of land and additions on the property. | Land | Improvement |
|---|---|---|---|---|
| 2025 | $10,540 | $763,800 | $434,200 | $329,600 |
| 2024 | $10,229 | $698,700 | $393,700 | $305,000 |
| 2023 | $10,111 | $655,300 | $375,800 | $279,500 |
| 2022 | $10,109 | $580,300 | $357,900 | $222,400 |
| 2021 | $9,944 | $559,900 | $349,000 | $210,900 |
| 2020 | $9,803 | $549,800 | $345,400 | $204,400 |
| 2019 | $9,753 | $545,800 | $340,000 | $205,800 |
| 2018 | $9,011 | $529,100 | $329,300 | $199,800 |
| 2017 | $8,683 | $514,100 | $315,000 | $199,100 |
| 2016 | $8,460 | $505,100 | $306,000 | $199,100 |
| 2015 | $7,454 | $464,700 | $276,000 | $188,700 |
| 2014 | $7,593 | $471,000 | $282,300 | $188,700 |
Property History
| Date | Event | Price | List to Sale | Price per Sq Ft |
|---|---|---|---|---|
| 11/03/2025 11/03/25 | Pending | -- | -- | -- |
| 10/30/2025 10/30/25 | For Sale | $829,900 | -- | $536 / Sq Ft |
Purchase History
| Date | Type | Sale Price | Title Company |
|---|---|---|---|
| Deed | $196,900 | -- | |
| Deed | $196,900 | -- | |
| Deed | $80,000 | -- | |
| Deed | $80,000 | -- |
Mortgage History
| Date | Status | Loan Amount | Loan Type |
|---|---|---|---|
| Closed | $177,300 | No Value Available | |
| Closed | $177,000 | No Value Available | |
| Closed | $177,200 | Purchase Money Mortgage |
Source: MLS Property Information Network (MLS PIN)
MLS Number: 73449702
APN: MEDF-000038-000000-000083
Disclaimer: Certain information contained herein is derived from information provided by parties other than Homes.com. All information provided is deemed reliable, but is not guaranteed to be accurate and should be independently verified.
![]() The property listing data and information, or the Images, set forth herein were provided to MLS Property Information Network, Inc. from third party sources, including sellers, lessors and public records, and were compiled by MLS Property Information Network, Inc. The property listing data and information, and the Images, are for the personal, non-commercial use of consumers having a good faith interest in purchasing or leasing listed properties of the type displayed to them and may not be used for any purpose other than to identify prospective properties which such consumers may have a good faith interest in purchasing or leasing. MLS Property Information Network, Inc. and its subscribers disclaim any and all representations and warranties as to the accuracy of the property listing data and information, or as to the accuracy of any of the Images, set forth herein.
The property listing data and information, or the Images, set forth herein were provided to MLS Property Information Network, Inc. from third party sources, including sellers, lessors and public records, and were compiled by MLS Property Information Network, Inc. The property listing data and information, and the Images, are for the personal, non-commercial use of consumers having a good faith interest in purchasing or leasing listed properties of the type displayed to them and may not be used for any purpose other than to identify prospective properties which such consumers may have a good faith interest in purchasing or leasing. MLS Property Information Network, Inc. and its subscribers disclaim any and all representations and warranties as to the accuracy of the property listing data and information, or as to the accuracy of any of the Images, set forth herein.
- 94 Pleasant St
- 10 Hillcrest Rd
- 15 Belknap Rd
- 435 Main St Unit B
- 431 Main St Unit 5
- 94 Elm St
- 18 Hearthstone Dr
- 34 Frairy St
- 46 Frairy St
- 111 Elm St
- 8 Turtlebrook Way
- 3 Hennery Way Bld E Unit 3
- 21 Winter St
- 14 Harding St
- 24 Pine Hill Dr
- 44 Millbrook Ave
- 270 South St
- 6 Alcott Way
- 12 Spruce Way
- 3 Shining Valley Cir