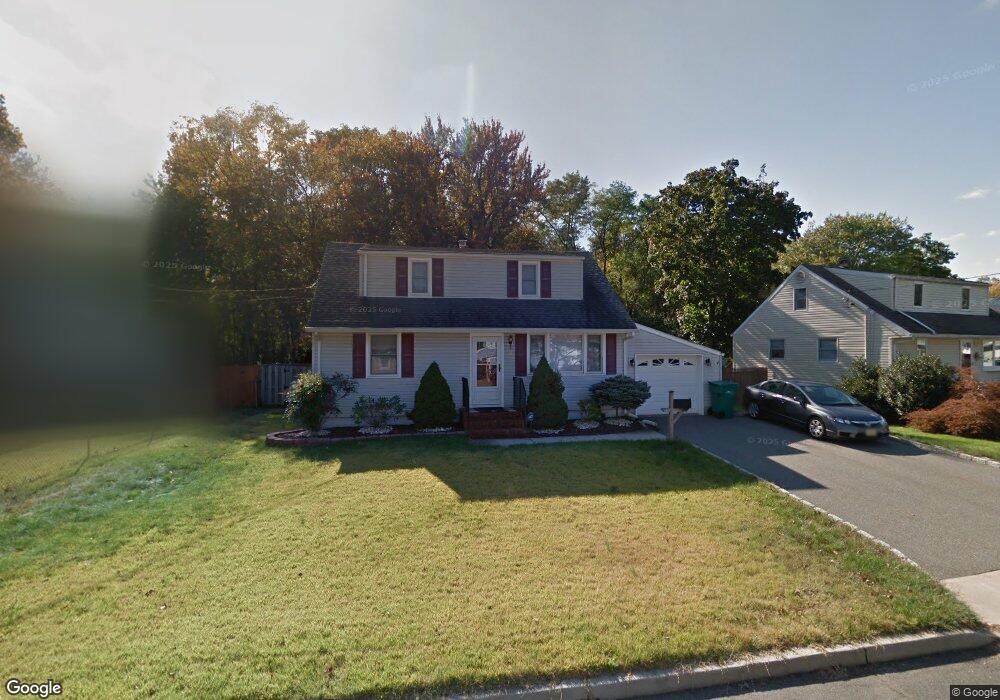
21 Piersoll Rd Old Bridge, NJ 08857
Estimated Value: $508,000 - $596,000
--
Bed
--
Bath
1,353
Sq Ft
$420/Sq Ft
Est. Value
About This Home
This home is located at 21 Piersoll Rd, Old Bridge, NJ 08857 and is currently estimated at $567,586, approximately $419 per square foot. 21 Piersoll Rd is a home located in Middlesex County with nearby schools including Old Bridge High School and St. Thomas the Apostle School.
Ownership History
Date
Name
Owned For
Owner Type
Purchase Details
Closed on
Aug 26, 2004
Sold by
Hutchinson Scott
Bought by
Chan Yuen Lan and Chan Richard
Current Estimated Value
Home Financials for this Owner
Home Financials are based on the most recent Mortgage that was taken out on this home.
Original Mortgage
$256,000
Outstanding Balance
$128,518
Interest Rate
6.08%
Estimated Equity
$439,068
Purchase Details
Closed on
Jun 8, 1995
Sold by
Marlow Jill
Bought by
Hutchinson Scott and Hutchinson Bethany
Home Financials for this Owner
Home Financials are based on the most recent Mortgage that was taken out on this home.
Original Mortgage
$108,000
Interest Rate
7.8%
Create a Home Valuation Report for This Property
The Home Valuation Report is an in-depth analysis detailing your home's value as well as a comparison with similar homes in the area
Home Values in the Area
Average Home Value in this Area
Purchase History
| Date | Buyer | Sale Price | Title Company |
|---|---|---|---|
| Chan Yuen Lan | $320,000 | -- | |
| Hutchinson Scott | $121,500 | -- |
Source: Public Records
Mortgage History
| Date | Status | Borrower | Loan Amount |
|---|---|---|---|
| Open | Chan Yuen Lan | $256,000 | |
| Previous Owner | Hutchinson Scott | $108,000 |
Source: Public Records
Tax History Compared to Growth
Tax History
| Year | Tax Paid | Tax Assessment Tax Assessment Total Assessment is a certain percentage of the fair market value that is determined by local assessors to be the total taxable value of land and additions on the property. | Land | Improvement |
|---|---|---|---|---|
| 2025 | $6,968 | $123,400 | $45,000 | $78,400 |
| 2024 | $6,685 | $123,400 | $45,000 | $78,400 |
| 2023 | $6,685 | $123,400 | $45,000 | $78,400 |
| 2022 | $6,532 | $123,400 | $45,000 | $78,400 |
| 2021 | $4,794 | $123,400 | $45,000 | $78,400 |
| 2020 | $6,339 | $123,400 | $45,000 | $78,400 |
| 2019 | $6,111 | $121,000 | $45,000 | $76,000 |
| 2018 | $6,043 | $121,000 | $45,000 | $76,000 |
| 2017 | $5,847 | $121,000 | $45,000 | $76,000 |
| 2016 | $5,726 | $121,000 | $45,000 | $76,000 |
| 2015 | $5,627 | $121,000 | $45,000 | $76,000 |
| 2014 | $5,570 | $121,000 | $45,000 | $76,000 |
Source: Public Records
Map
Nearby Homes