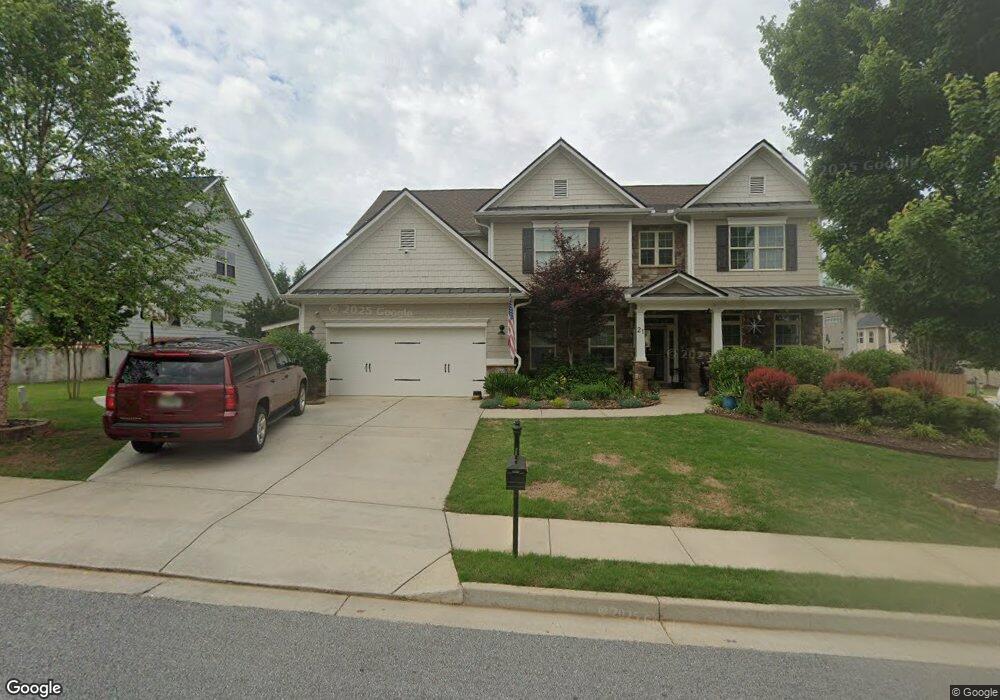
21 Pillar Point Unit 600 Newnan, GA 30265
Estimated Value: $499,000 - $556,000
5
Beds
3
Baths
3,600
Sq Ft
$146/Sq Ft
Est. Value
About This Home
This home is located at 21 Pillar Point Unit 600, Newnan, GA 30265 and is currently estimated at $525,536, approximately $145 per square foot. 21 Pillar Point Unit 600 is a home located in Coweta County with nearby schools including Newnan Crossing Elementary School, Arnall Middle School, and East Coweta High School.
Ownership History
Date
Name
Owned For
Owner Type
Purchase Details
Closed on
Dec 22, 2015
Sold by
Nvh Homes Llc
Bought by
Espinosa Tomas E
Current Estimated Value
Home Financials for this Owner
Home Financials are based on the most recent Mortgage that was taken out on this home.
Original Mortgage
$326,324
Outstanding Balance
$261,365
Interest Rate
3.97%
Mortgage Type
VA
Estimated Equity
$264,171
Purchase Details
Closed on
Jan 3, 2014
Sold by
Stonebridge At Newnan Crossing
Bought by
Nvh Homes Llc
Purchase Details
Closed on
Jun 19, 2003
Sold by
Newnan Crossing Partnersh
Bought by
Stonebridge At Newnan Crossing Llc
Purchase Details
Closed on
Apr 4, 2001
Sold by
Lewisphthe Salvation Army
Bought by
Newnan Crossing Partnersh
Purchase Details
Closed on
Apr 17, 1989
Bought by
Newnan Crossing Part
Purchase Details
Closed on
Apr 5, 1989
Bought by
Signa Development Co
Create a Home Valuation Report for This Property
The Home Valuation Report is an in-depth analysis detailing your home's value as well as a comparison with similar homes in the area
Home Values in the Area
Average Home Value in this Area
Purchase History
| Date | Buyer | Sale Price | Title Company |
|---|---|---|---|
| Espinosa Tomas E | $315,900 | -- | |
| Nvh Homes Llc | $20,000 | -- | |
| Stonebridge At Newnan Crossing Llc | $6,921,900 | -- | |
| Newnan Crossing Partnersh | -- | -- | |
| Newnan Crossing Part | -- | -- | |
| Signa Development Co | -- | -- |
Source: Public Records
Mortgage History
| Date | Status | Borrower | Loan Amount |
|---|---|---|---|
| Open | Espinosa Tomas E | $326,324 |
Source: Public Records
Tax History Compared to Growth
Tax History
| Year | Tax Paid | Tax Assessment Tax Assessment Total Assessment is a certain percentage of the fair market value that is determined by local assessors to be the total taxable value of land and additions on the property. | Land | Improvement |
|---|---|---|---|---|
| 2025 | $5,153 | $224,702 | $30,000 | $194,702 |
| 2024 | $4,664 | $207,499 | $30,000 | $177,499 |
| 2023 | $4,664 | $190,644 | $26,000 | $164,644 |
| 2022 | $4,279 | $179,378 | $26,000 | $153,378 |
| 2021 | $3,773 | $143,952 | $16,000 | $127,952 |
| 2020 | $3,606 | $158,659 | $16,000 | $142,659 |
| 2019 | $3,593 | $123,347 | $16,000 | $107,347 |
| 2018 | $3,614 | $123,347 | $16,000 | $107,347 |
| 2017 | $3,463 | $118,874 | $16,000 | $102,874 |
| 2016 | $3,171 | $109,034 | $16,000 | $93,034 |
| 2015 | $241 | $10,000 | $10,000 | $0 |
| 2014 | $534 | $10,000 | $10,000 | $0 |
Source: Public Records
Map
Nearby Homes
- 361 Granite Way
- 24 Stonebridge Pass
- 8 Bryce Creek Dr
- 20 Bryce Creek Dr
- 9 Ravine Dr
- 35 Canyon View Dr
- 80 Creekside Way
- 152 Stonebridge Crossing
- 93 Greentree Dr
- 186 Granite Way
- 37 Greentree Dr
- 75 Courtyard Ln
- 90 Courtyard Ln
- 49 Granite Way
- 140 Greentree Dr
- 146 Greentree Dr
- 22 Barberry Dr
- 7 Paw Ln
- 112 Granite Way
- 16 Daybreak Ln
- 21 Pillar Point
- 19 Pillar Point Unit 599
- 38 Boulder Bend
- 34 Boulder Bend
- 353 Granite Way
- 353 Granite Way Unit 627
- 357 Granite Way Unit 626
- 357 Granite Way
- 17 Pillar Point Unit 598
- 17 Pillar Point
- 22 Pillar Point Unit 601
- 30 Boulder Bend
- 20 Pillar Point Unit 602
- 20 Pillar Point
- 349 Granite Way
- 16 Pillar Point Unit 603
- 16 Pillar Point
- 26 Boulder Bend
- 365 Granite Way
- 15 Pillar Point Unit 597