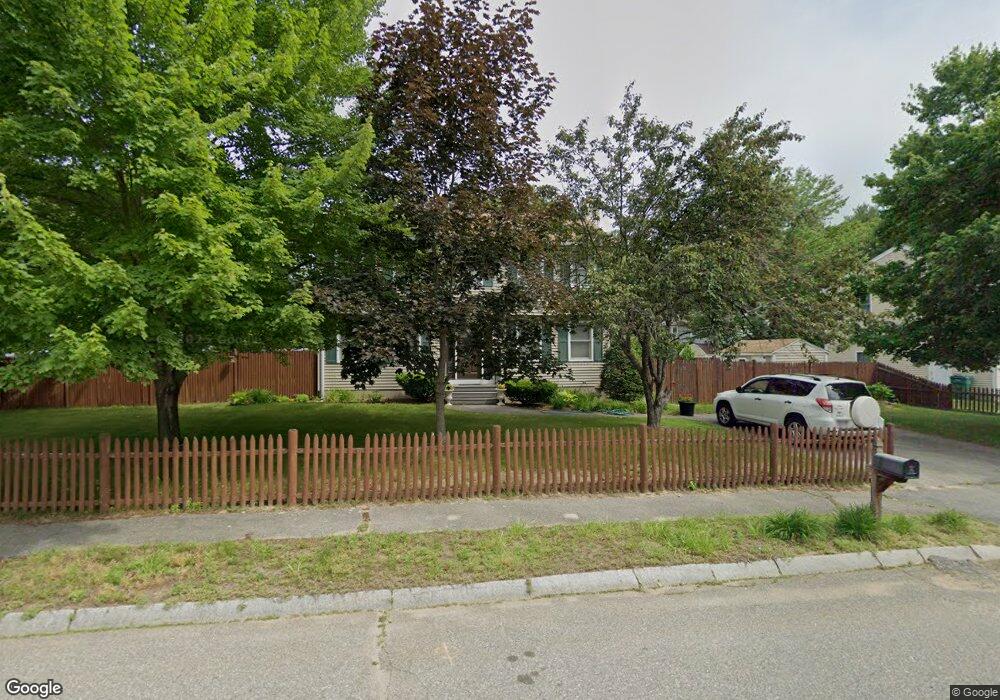
21 Pine Tree Ln Lowell, MA 01854
Pawtucketville NeighborhoodEstimated Value: $589,000 - $639,000
3
Beds
2
Baths
1,666
Sq Ft
$373/Sq Ft
Est. Value
About This Home
This home is located at 21 Pine Tree Ln, Lowell, MA 01854 and is currently estimated at $621,637, approximately $373 per square foot. 21 Pine Tree Ln is a home located in Middlesex County with nearby schools including Joseph McAvinnue Elementary School, Charles W. Morey Elementary School, and Charlotte M. Murkland Elementary School.
Ownership History
Date
Name
Owned For
Owner Type
Purchase Details
Closed on
Jan 16, 2004
Sold by
Dixon Vanessa E
Bought by
Realejo Maria and Realejo Miguel
Current Estimated Value
Home Financials for this Owner
Home Financials are based on the most recent Mortgage that was taken out on this home.
Original Mortgage
$155,000
Outstanding Balance
$72,325
Interest Rate
5.98%
Mortgage Type
Purchase Money Mortgage
Estimated Equity
$549,312
Purchase Details
Closed on
Aug 28, 1998
Sold by
Hartman Christopher E and Hartman Paula M
Bought by
Dixon Vanessa E
Purchase Details
Closed on
Mar 15, 1996
Sold by
Saco Construction Inc
Bought by
Hartman Christopher and Hartman Paula
Create a Home Valuation Report for This Property
The Home Valuation Report is an in-depth analysis detailing your home's value as well as a comparison with similar homes in the area
Home Values in the Area
Average Home Value in this Area
Purchase History
| Date | Buyer | Sale Price | Title Company |
|---|---|---|---|
| Realejo Maria | $345,000 | -- | |
| Realejo Maria | $345,000 | -- | |
| Dixon Vanessa E | $151,000 | -- | |
| Dixon Vanessa E | $151,000 | -- | |
| Hartman Christopher | $134,000 | -- | |
| Hartman Christopher | $134,000 | -- |
Source: Public Records
Mortgage History
| Date | Status | Borrower | Loan Amount |
|---|---|---|---|
| Open | Hartman Christopher | $50,000 | |
| Open | Realejo Maria | $155,000 | |
| Closed | Hartman Christopher | $155,000 | |
| Previous Owner | Hartman Christopher | $146,100 |
Source: Public Records
Tax History
| Year | Tax Paid | Tax Assessment Tax Assessment Total Assessment is a certain percentage of the fair market value that is determined by local assessors to be the total taxable value of land and additions on the property. | Land | Improvement |
|---|---|---|---|---|
| 2025 | $6,044 | $526,500 | $202,100 | $324,400 |
| 2024 | $6,112 | $513,200 | $188,800 | $324,400 |
| 2023 | $5,760 | $463,800 | $164,200 | $299,600 |
| 2022 | $4,972 | $391,800 | $129,500 | $262,300 |
| 2021 | $4,723 | $350,900 | $112,600 | $238,300 |
| 2020 | $4,553 | $340,800 | $112,600 | $228,200 |
| 2019 | $4,403 | $313,600 | $101,100 | $212,500 |
| 2018 | $4,370 | $303,700 | $96,200 | $207,500 |
| 2017 | $4,248 | $284,700 | $90,300 | $194,400 |
| 2016 | $4,251 | $280,400 | $86,000 | $194,400 |
| 2015 | $4,113 | $265,700 | $84,200 | $181,500 |
| 2013 | $3,876 | $258,200 | $97,400 | $160,800 |
Source: Public Records
Map
Nearby Homes
- 20 Sandy Ln
- 3 Louis Farm Rd Unit 3
- 1401 Pawtucket Blvd Unit 10
- 1461 Pawtucket Blvd Unit 12
- 152 Wellman Ave Unit 152
- 16 Middlesex St Unit 4
- 262 Wellman Ave Unit 262
- 251 Wellman Ave Unit 251
- 29 Middlesex St Unit 1
- 15 Robin Ln
- 1975 Middlesex St Unit 51
- 1975 Middlesex St Unit 10
- 24 Brouilette St Unit A
- 16 Washington St
- 10 Butterfield St
- 248 Acropolis Rd
- 527 Pawtucket Blvd Unit 207
- 331 Wellman Ave
- 591 Varnum Ave
- 5 Augusta Way
Your Personal Tour Guide
Ask me questions while you tour the home.