Estimated Value: $298,000 - $320,000
3
Beds
3
Baths
1,616
Sq Ft
$190/Sq Ft
Est. Value
About This Home
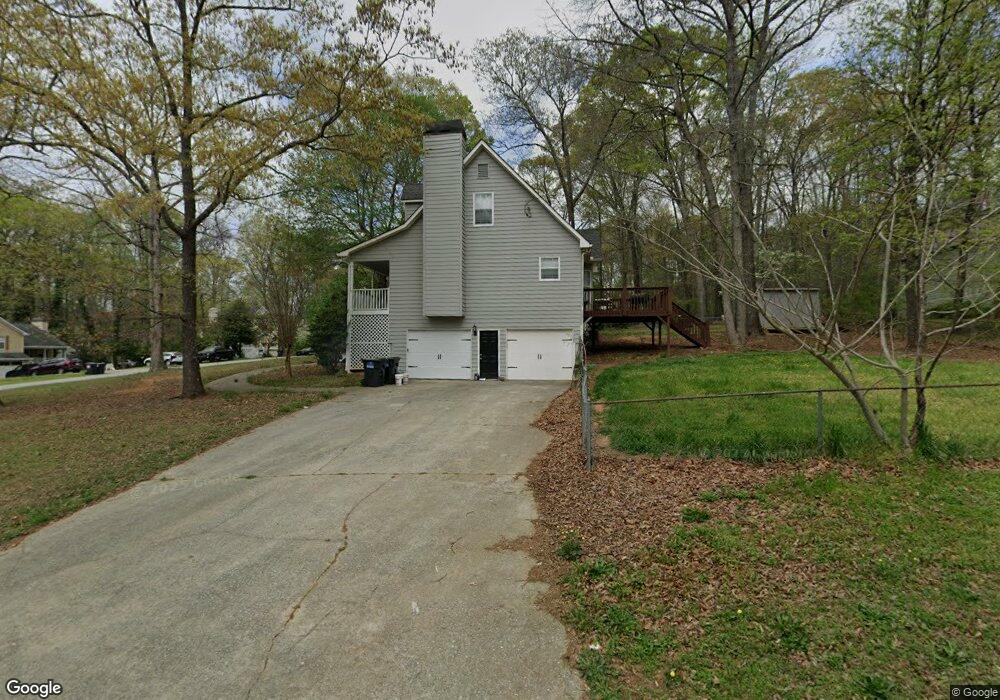
This home is located at 21 Poole Bridge Ct, Hiram, GA 30141 and is currently estimated at $306,311, approximately $189 per square foot. 21 Poole Bridge Ct is a home located in Paulding County with nearby schools including Bessie L. Baggett Elementary School, Irma C. Austin Middle School, and Hiram High School.
Ownership History
Date
Name
Owned For
Owner Type
Purchase Details
Closed on
Jan 24, 2025
Sold by
Sfr Xii Nm Atl Owner 1 Lp
Bought by
Star Borrower Sfr5 Lp
Current Estimated Value
Purchase Details
Closed on
May 18, 2022
Sold by
Sfr Xii Atl Owner 7 Lp
Bought by
Sfr Xii Nm Atl Owner 1 Lp
Purchase Details
Closed on
Dec 17, 2021
Sold by
Legras Joseph B
Bought by
Sfr Xii Atl Owner 7 Lp
Purchase Details
Closed on
Jun 27, 2018
Sold by
Operation
Bought by
Legras Joseph B
Purchase Details
Closed on
Jan 5, 2016
Sold by
Jpmorgan Chase Bank Na
Bought by
Operation Homefront Inc
Purchase Details
Closed on
Jul 7, 2015
Sold by
Mcentyre John
Bought by
Jpmorgan Chase Bank Na
Purchase Details
Closed on
Oct 18, 1994
Sold by
Kwc Prop
Bought by
Mcentyre John Stefanie
Create a Home Valuation Report for This Property
The Home Valuation Report is an in-depth analysis detailing your home's value as well as a comparison with similar homes in the area
Home Values in the Area
Average Home Value in this Area
Purchase History
| Date | Buyer | Sale Price | Title Company |
|---|---|---|---|
| Star Borrower Sfr5 Lp | -- | -- | |
| Sfr Xii Nm Atl Owner 1 Lp | -- | -- | |
| Sfr Xii Atl Owner 7 Lp | $270,100 | -- | |
| Legras Joseph B | -- | -- | |
| Operation Homefront Inc | -- | -- | |
| Jpmorgan Chase Bank Na | $92,914 | -- | |
| Mcentyre John Stefanie | $94,200 | -- |
Source: Public Records
Mortgage History
| Date | Status | Borrower | Loan Amount |
|---|---|---|---|
| Closed | Mcentyre John Stefanie | -- |
Source: Public Records
Tax History Compared to Growth
Tax History
| Year | Tax Paid | Tax Assessment Tax Assessment Total Assessment is a certain percentage of the fair market value that is determined by local assessors to be the total taxable value of land and additions on the property. | Land | Improvement |
|---|---|---|---|---|
| 2024 | $3,056 | $122,840 | $12,000 | $110,840 |
| 2023 | $3,084 | $119,664 | $12,000 | $107,664 |
| 2022 | $2,653 | $101,756 | $12,000 | $89,756 |
| 2021 | $2,227 | $76,636 | $10,000 | $66,636 |
| 2020 | $2,087 | $70,260 | $10,000 | $60,260 |
| 2019 | $2,035 | $67,528 | $10,000 | $57,528 |
| 2018 | $1,840 | $61,076 | $10,000 | $51,076 |
| 2017 | $1,490 | $48,760 | $10,000 | $38,760 |
| 2016 | $1,124 | $41,900 | $10,000 | $31,900 |
| 2015 | $985 | $33,856 | $10,000 | $23,856 |
| 2014 | $934 | $31,440 | $10,000 | $21,440 |
| 2013 | -- | $31,760 | $12,000 | $19,760 |
Source: Public Records
Map
Nearby Homes
- 21 Poole Bridge Ct
- 230 Poole Bridge Dr
- 43 Poole Bridge Ct
- 184 Poole Bridge Dr
- 215 Poole Bridge Dr
- 215 Poole Bridge Dr Unit 11
- 233 Poole Bridge Dr
- 197 Poole Bridge Dr
- 36 Poole Bridge Ct
- 250 Poole Bridge Dr
- 247 Poole Bridge Dr
- 255 Poole Bridge Dr
- 54 Poole Bridge Ct
- 171 Poole Bridge Dr
- 59 Poole Bridge Ct
- 64 Poole Bridge Ct
- 161 Poole Bridge Dr
- 135 Poole Bridge Dr
- 63 Poole Bridge Ln
- 31 Poole Bridge Ln