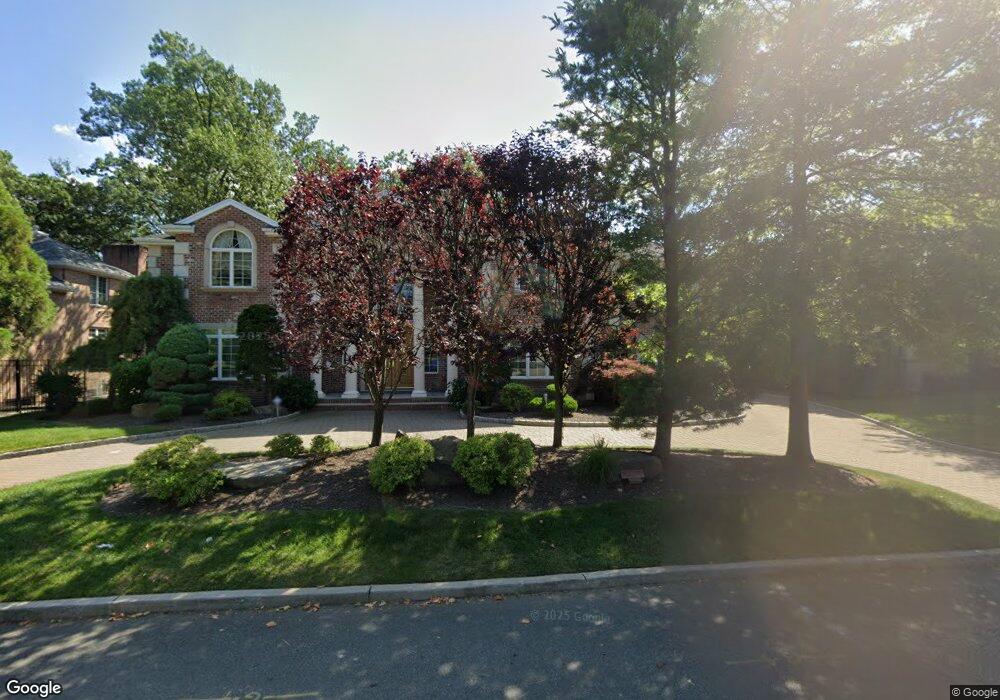
21 Priscilla Ln Englewood Cliffs, NJ 07632
Estimated Value: $3,425,701 - $3,937,000
--
Bed
--
Bath
6,095
Sq Ft
$592/Sq Ft
Est. Value
About This Home
This home is located at 21 Priscilla Ln, Englewood Cliffs, NJ 07632 and is currently estimated at $3,609,234, approximately $592 per square foot. 21 Priscilla Ln is a home located in Bergen County with nearby schools including North Cliff Elementary School, Upper School Elementary School, and Englewood on the Palisades Charter School.
Ownership History
Date
Name
Owned For
Owner Type
Purchase Details
Closed on
Aug 31, 2007
Sold by
Kim James T
Bought by
Kim Chong Seung and Kim Soon Lim
Current Estimated Value
Home Financials for this Owner
Home Financials are based on the most recent Mortgage that was taken out on this home.
Original Mortgage
$3,000,000
Outstanding Balance
$1,912,013
Interest Rate
6.7%
Mortgage Type
Credit Line Revolving
Estimated Equity
$1,697,221
Purchase Details
Closed on
Dec 9, 2004
Sold by
Rubin Sondra
Bought by
Kim James
Home Financials for this Owner
Home Financials are based on the most recent Mortgage that was taken out on this home.
Original Mortgage
$700,000
Interest Rate
5.74%
Create a Home Valuation Report for This Property
The Home Valuation Report is an in-depth analysis detailing your home's value as well as a comparison with similar homes in the area
Home Values in the Area
Average Home Value in this Area
Purchase History
| Date | Buyer | Sale Price | Title Company |
|---|---|---|---|
| Kim Chong Seung | $2,700,000 | -- | |
| Kim James | $940,000 | -- |
Source: Public Records
Mortgage History
| Date | Status | Borrower | Loan Amount |
|---|---|---|---|
| Open | Kim Chong Seung | $3,000,000 | |
| Closed | Kim Chong Seung | $675,000 | |
| Previous Owner | Kim James | $700,000 |
Source: Public Records
Tax History Compared to Growth
Tax History
| Year | Tax Paid | Tax Assessment Tax Assessment Total Assessment is a certain percentage of the fair market value that is determined by local assessors to be the total taxable value of land and additions on the property. | Land | Improvement |
|---|---|---|---|---|
| 2025 | $31,826 | $2,755,500 | $1,050,000 | $1,705,500 |
| 2024 | $31,440 | $2,755,500 | $1,050,000 | $1,705,500 |
| 2023 | $30,944 | $2,755,500 | $1,050,000 | $1,705,500 |
| 2022 | $30,944 | $2,755,500 | $1,050,000 | $1,705,500 |
| 2021 | $23,787 | $2,755,500 | $1,050,000 | $1,705,500 |
| 2020 | $31,716 | $2,755,500 | $1,050,000 | $1,705,500 |
| 2019 | $29,787 | $2,755,500 | $1,050,000 | $1,705,500 |
| 2018 | $28,740 | $2,755,500 | $1,050,000 | $1,705,500 |
| 2017 | $27,500 | $2,755,500 | $1,050,000 | $1,705,500 |
| 2016 | $26,976 | $2,755,500 | $1,050,000 | $1,705,500 |
| 2015 | $25,626 | $2,755,500 | $1,050,000 | $1,705,500 |
| 2014 | $23,973 | $2,755,500 | $1,050,000 | $1,705,500 |
Source: Public Records
Map
Nearby Homes