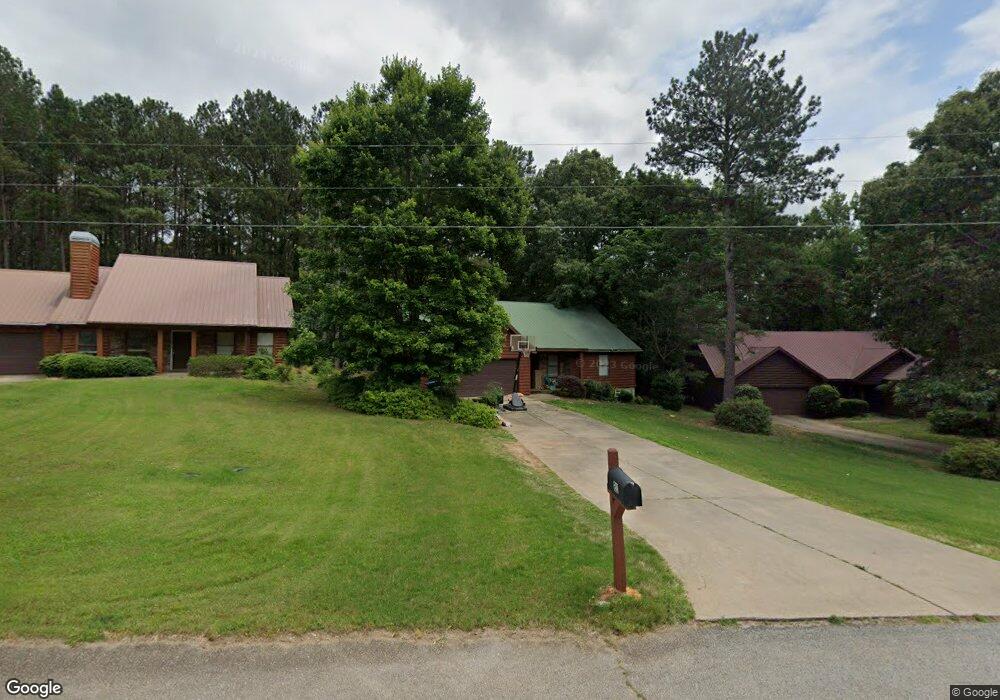
21 Providence Point Ln Unit LOT Hartwell, GA 30643
Estimated Value: $305,366 - $458,000
3
Beds
2
Baths
1,690
Sq Ft
$222/Sq Ft
Est. Value
About This Home
This home is located at 21 Providence Point Ln Unit LOT, Hartwell, GA 30643 and is currently estimated at $375,842, approximately $222 per square foot. 21 Providence Point Ln Unit LOT is a home located in Hart County with nearby schools including Hart County High School.
Ownership History
Date
Name
Owned For
Owner Type
Purchase Details
Closed on
Apr 21, 2017
Sold by
Sanders Kelly Dennis
Bought by
Jones Jaclyn M and Jones Elias A
Current Estimated Value
Home Financials for this Owner
Home Financials are based on the most recent Mortgage that was taken out on this home.
Original Mortgage
$140,650
Outstanding Balance
$117,106
Interest Rate
4.23%
Mortgage Type
New Conventional
Estimated Equity
$258,736
Purchase Details
Closed on
Oct 25, 2013
Sold by
Glenn Katherine Leigh
Bought by
Sanders Kelly Dennis
Home Financials for this Owner
Home Financials are based on the most recent Mortgage that was taken out on this home.
Original Mortgage
$114,750
Interest Rate
4.63%
Mortgage Type
New Conventional
Purchase Details
Closed on
Aug 5, 2005
Sold by
Timberwood Homes Inc
Bought by
Davidson Katherine Leigh
Home Financials for this Owner
Home Financials are based on the most recent Mortgage that was taken out on this home.
Original Mortgage
$99,500
Interest Rate
5.57%
Mortgage Type
New Conventional
Purchase Details
Closed on
Dec 1, 2003
Purchase Details
Closed on
Jan 1, 2002
Create a Home Valuation Report for This Property
The Home Valuation Report is an in-depth analysis detailing your home's value as well as a comparison with similar homes in the area
Home Values in the Area
Average Home Value in this Area
Purchase History
| Date | Buyer | Sale Price | Title Company |
|---|---|---|---|
| Jones Jaclyn M | $145,000 | -- | |
| Sanders Kelly Dennis | $135,000 | -- | |
| Davidson Katherine Leigh | $145,000 | -- | |
| -- | $40,000 | -- | |
| -- | $272,000 | -- | |
| -- | $1,197,000 | -- |
Source: Public Records
Mortgage History
| Date | Status | Borrower | Loan Amount |
|---|---|---|---|
| Open | Jones Jaclyn M | $140,650 | |
| Previous Owner | Sanders Kelly Dennis | $114,750 | |
| Previous Owner | Davidson Katherine Leigh | $99,500 |
Source: Public Records
Tax History Compared to Growth
Tax History
| Year | Tax Paid | Tax Assessment Tax Assessment Total Assessment is a certain percentage of the fair market value that is determined by local assessors to be the total taxable value of land and additions on the property. | Land | Improvement |
|---|---|---|---|---|
| 2024 | $1,518 | $100,214 | $16,000 | $84,214 |
| 2023 | $1,414 | $86,912 | $16,000 | $70,912 |
| 2022 | $1,276 | $78,629 | $16,000 | $62,629 |
| 2021 | $1,242 | $68,971 | $12,000 | $56,971 |
| 2020 | $1,185 | $63,189 | $10,000 | $53,189 |
| 2019 | $1,103 | $58,422 | $8,000 | $50,422 |
| 2018 | $1,147 | $58,442 | $8,000 | $50,442 |
| 2017 | $1,150 | $57,843 | $8,000 | $49,843 |
| 2016 | $1,176 | $57,342 | $8,000 | $49,342 |
| 2015 | $1,130 | $58,060 | $10,000 | $48,060 |
| 2014 | $1,072 | $62,778 | $12,000 | $50,778 |
| 2013 | -- | $63,336 | $12,000 | $51,336 |
Source: Public Records
Map
Nearby Homes
- 120 Providence Point Ln
- 60 Browns Ln
- 339 Lightwood Ln
- 209 Snowbird Ln
- 73 Yacht Club Pointe
- 425 Wyndward Point Dr
- 0 Yacht Club Rd Unit LOT 4
- 0 Pineywoods Rd Unit 10551989
- 36 Crest Dr Unit Lot 23
- 40 Crest Dr Unit 24
- 103 Joy Ln Unit LAKE HARTWELL DUPLEX
- 101 AND 103 Joy Ln Unit DUPLEX ON LAKE HARTW
- LOT 22 Majestic Shores Rd
- LOT 25 Majestic Shores Rd
- LOT 13 Majestic Shores Rd
- LOT 5 Majestic Shores Rd
- LOT E Majestic Shores Rd
- LOT 12 Majestic Shores Rd
- LOT 4 Majestic Shores Rd
- LOT 7 Majestic Shores Rd
- 21 Providence Point Ln
- 29 Providence Pointe Ln
- 39 Providence Point Ln
- 7 Providence Pointe Ln
- 3 Providence Pointe Ln
- 1190 Yacht Club Rd
- LOT 4 Yacht Club Point
- 13 Providence Point Ln
- 1180 Yacht Club Rd
- 1168 Yacht Club Rd
- Lot 15 Providence Pointe Ln
- Lot 22 Providence Pointe Ln
- Lot 18 Providence Pointe Ln
- Lot 16 Providence Pointe Ln
- Lot 21 Providence Pointe Ln
- 82 Providence Point Ln
- 1286 Yacht Club Rd
- 1299 Yacht Club Rd
- 100 Providence Point Ln
- 99 Providence Point Ln