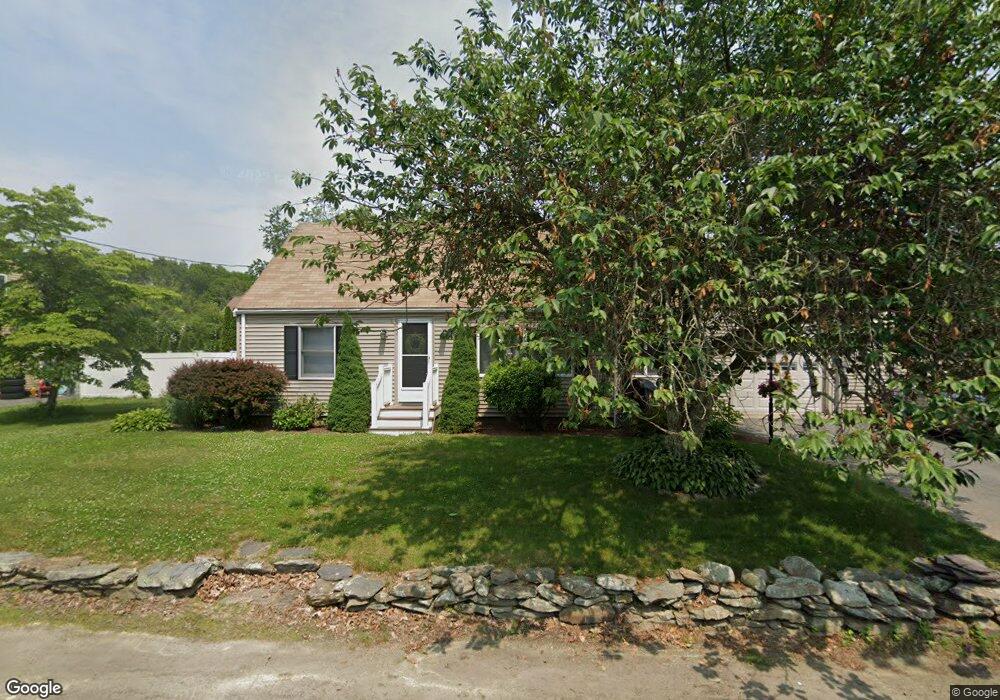
21 Purchase St West Bridgewater, MA 02379
Estimated Value: $463,000 - $584,000
3
Beds
1
Bath
1,602
Sq Ft
$334/Sq Ft
Est. Value
About This Home
This home is located at 21 Purchase St, West Bridgewater, MA 02379 and is currently estimated at $534,811, approximately $333 per square foot. 21 Purchase St is a home located in Plymouth County with nearby schools including Spring Street Elementary School, Howard Elementary School, and Rose L. MacDonald Elementary School.
Ownership History
Date
Name
Owned For
Owner Type
Purchase Details
Closed on
Nov 2, 2018
Sold by
Oconnell Janet L
Bought by
Jenkinson 2Nd William E
Current Estimated Value
Home Financials for this Owner
Home Financials are based on the most recent Mortgage that was taken out on this home.
Original Mortgage
$329,800
Outstanding Balance
$288,801
Interest Rate
4.6%
Mortgage Type
New Conventional
Estimated Equity
$246,010
Purchase Details
Closed on
Oct 15, 1980
Bought by
Oconnell Daniel and Oconnell Janet
Create a Home Valuation Report for This Property
The Home Valuation Report is an in-depth analysis detailing your home's value as well as a comparison with similar homes in the area
Home Values in the Area
Average Home Value in this Area
Purchase History
| Date | Buyer | Sale Price | Title Company |
|---|---|---|---|
| Jenkinson 2Nd William E | $340,000 | -- | |
| Oconnell Daniel | $53,900 | -- |
Source: Public Records
Mortgage History
| Date | Status | Borrower | Loan Amount |
|---|---|---|---|
| Open | Jenkinson 2Nd William E | $329,800 | |
| Previous Owner | Oconnell Daniel | $200,000 | |
| Previous Owner | Oconnell Daniel | $120,000 |
Source: Public Records
Tax History Compared to Growth
Tax History
| Year | Tax Paid | Tax Assessment Tax Assessment Total Assessment is a certain percentage of the fair market value that is determined by local assessors to be the total taxable value of land and additions on the property. | Land | Improvement |
|---|---|---|---|---|
| 2025 | $5,832 | $426,600 | $197,600 | $229,000 |
| 2024 | $5,616 | $396,300 | $179,200 | $217,100 |
| 2023 | $5,247 | $341,400 | $155,100 | $186,300 |
| 2022 | $4,980 | $307,000 | $145,900 | $161,100 |
| 2021 | $5,130 | $307,000 | $145,900 | $161,100 |
| 2020 | $5,026 | $307,000 | $145,900 | $161,100 |
| 2019 | $4,665 | $282,200 | $145,900 | $136,300 |
| 2018 | $5,218 | $260,300 | $138,500 | $121,800 |
| 2017 | $4,282 | $241,500 | $125,600 | $115,900 |
| 2016 | $4,187 | $232,600 | $116,700 | $115,900 |
| 2015 | $4,143 | $232,600 | $116,700 | $115,900 |
| 2014 | $3,817 | $231,500 | $116,700 | $114,800 |
Source: Public Records
Map
Nearby Homes