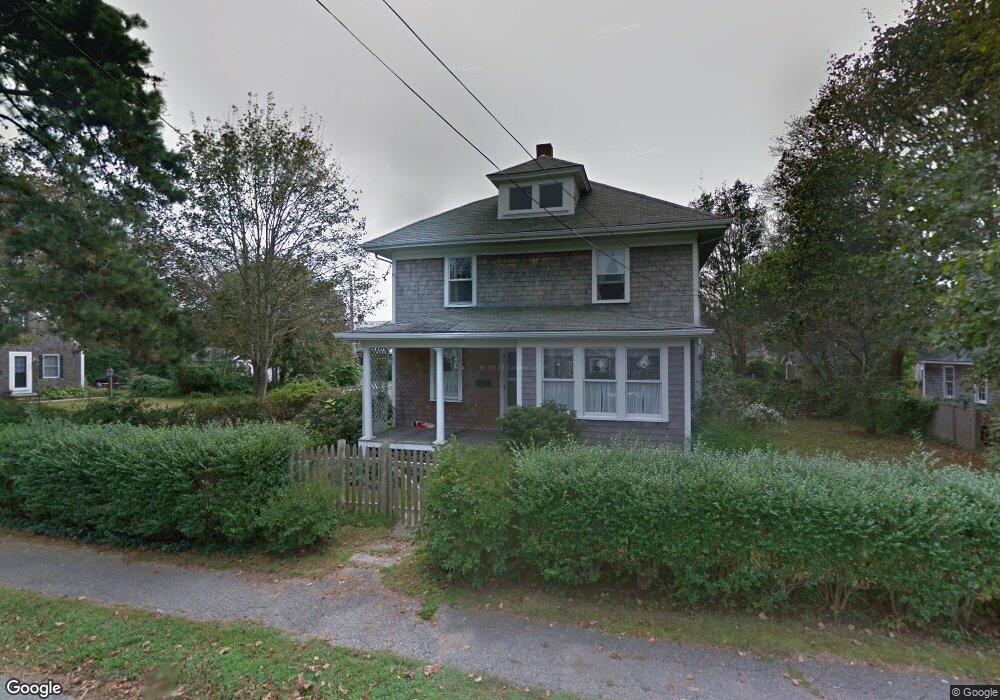
21 Queen St Falmouth, MA 02540
Falmouth Village NeighborhoodEstimated Value: $692,000 - $1,007,000
4
Beds
2
Baths
1,801
Sq Ft
$458/Sq Ft
Est. Value
About This Home
This home is located at 21 Queen St, Falmouth, MA 02540 and is currently estimated at $825,139, approximately $458 per square foot. 21 Queen St is a home located in Barnstable County with nearby schools including Mullen-Hall School, Lawrence School, and Morse Pond School.
Ownership History
Date
Name
Owned For
Owner Type
Purchase Details
Closed on
Aug 8, 2023
Sold by
Howland Jonathan C and Howland Ellen L
Bought by
Howland
Current Estimated Value
Purchase Details
Closed on
Oct 7, 1996
Sold by
Stepchew Joseph and Stepchew Frances R
Bought by
Howland Jonathan C and Howland Ellen L
Home Financials for this Owner
Home Financials are based on the most recent Mortgage that was taken out on this home.
Original Mortgage
$132,000
Interest Rate
7.9%
Mortgage Type
Purchase Money Mortgage
Create a Home Valuation Report for This Property
The Home Valuation Report is an in-depth analysis detailing your home's value as well as a comparison with similar homes in the area
Home Values in the Area
Average Home Value in this Area
Purchase History
| Date | Buyer | Sale Price | Title Company |
|---|---|---|---|
| Howland | -- | None Available | |
| Howland | -- | None Available | |
| Howland Jonathan C | $165,000 | -- | |
| Howland Jonathan C | $165,000 | -- |
Source: Public Records
Mortgage History
| Date | Status | Borrower | Loan Amount |
|---|---|---|---|
| Previous Owner | Howland Jonathan C | $123,000 | |
| Previous Owner | Howland Jonathan C | $130,000 | |
| Previous Owner | Howland Jonathan C | $132,000 |
Source: Public Records
Tax History Compared to Growth
Tax History
| Year | Tax Paid | Tax Assessment Tax Assessment Total Assessment is a certain percentage of the fair market value that is determined by local assessors to be the total taxable value of land and additions on the property. | Land | Improvement |
|---|---|---|---|---|
| 2025 | $3,648 | $621,500 | $316,400 | $305,100 |
| 2024 | $3,566 | $567,800 | $287,700 | $280,100 |
| 2023 | $3,607 | $521,300 | $287,700 | $233,600 |
| 2022 | $3,978 | $494,100 | $262,300 | $231,800 |
| 2021 | $3,967 | $466,700 | $250,900 | $215,800 |
| 2020 | $3,813 | $443,900 | $228,100 | $215,800 |
| 2019 | $3,732 | $436,000 | $228,100 | $207,900 |
| 2018 | $3,643 | $423,600 | $228,100 | $195,500 |
| 2017 | $3,526 | $413,400 | $228,100 | $185,300 |
| 2016 | $3,460 | $413,400 | $228,100 | $185,300 |
| 2015 | $3,296 | $402,500 | $228,100 | $174,400 |
| 2014 | $3,318 | $407,100 | $228,100 | $179,000 |
Source: Public Records
Map
Nearby Homes
- 480 Main St Unit 1
- 253 Scranton Ave
- 65 Walker St
- 110 Dillingham Ave Unit 322
- 110 Dillingham Ave Unit 224
- 98 Main St
- 98 Main St Unit 1
- 71 Main St
- 30 Katherine Lee Bates Rd
- 55 Jericho Path
- 9 Fairmount Ave Unit 1
- 9 Fairmount Ave
- 33 Oakwood Ave
- 22 Alma Rd
- 286 Grand Ave Unit 6
- 286 Grand Ave Unit 8
- 286 Grand Ave Unit 4
- 15 Hedge Ln
- 354 Gifford St Unit 5
- 354 Gifford St Unit 2