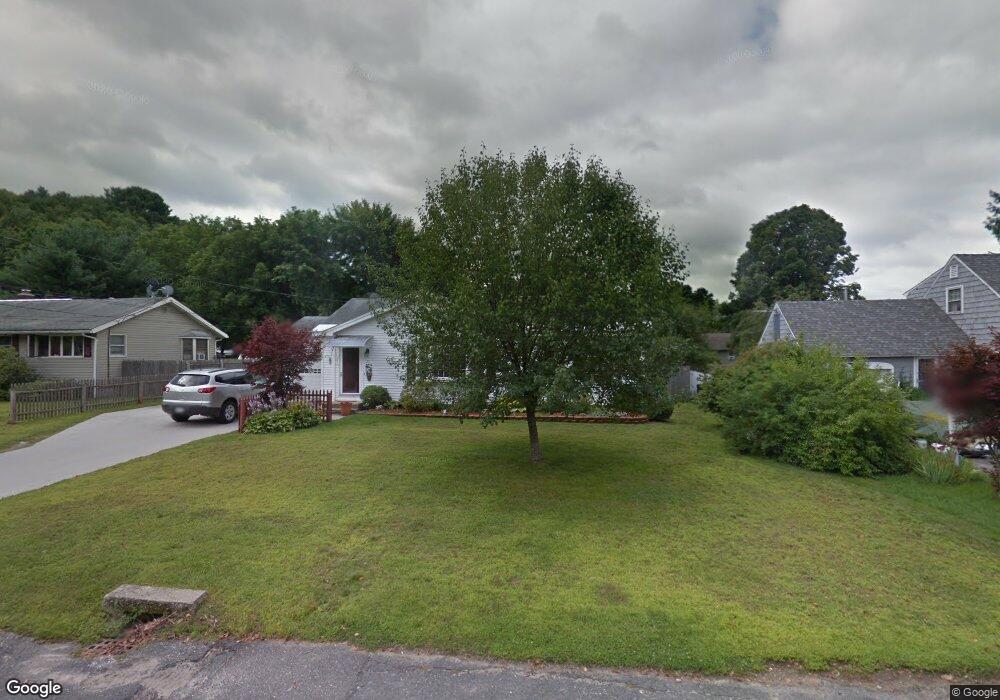
21 Quirico Dr Pittsfield, MA 01201
Estimated Value: $351,846 - $369,000
4
Beds
1
Bath
1,726
Sq Ft
$209/Sq Ft
Est. Value
About This Home
This home is located at 21 Quirico Dr, Pittsfield, MA 01201 and is currently estimated at $361,212, approximately $209 per square foot. 21 Quirico Dr is a home located in Berkshire County with nearby schools including Egremont Elementary School, Theodore Herberg Middle School, and Pittsfield High School.
Ownership History
Date
Name
Owned For
Owner Type
Purchase Details
Closed on
Sep 22, 2006
Sold by
Elser David M and Elser Nicole R
Bought by
Elser Nicole R
Current Estimated Value
Purchase Details
Closed on
Oct 5, 1993
Sold by
Michalski Joseph T and Michalski Dian D
Bought by
Michalski Joseph T
Create a Home Valuation Report for This Property
The Home Valuation Report is an in-depth analysis detailing your home's value as well as a comparison with similar homes in the area
Home Values in the Area
Average Home Value in this Area
Purchase History
| Date | Buyer | Sale Price | Title Company |
|---|---|---|---|
| Elser Nicole R | -- | -- | |
| Elser Nicole R | -- | -- | |
| Elser Nicole R | -- | -- | |
| Michalski Joseph T | $26,750 | -- | |
| Michalski Joseph T | $26,750 | -- |
Source: Public Records
Mortgage History
| Date | Status | Borrower | Loan Amount |
|---|---|---|---|
| Previous Owner | Michalski Joseph T | $118,400 | |
| Previous Owner | Michalski Joseph T | $15,000 | |
| Previous Owner | Michalski Joseph T | $68,500 |
Source: Public Records
Tax History Compared to Growth
Tax History
| Year | Tax Paid | Tax Assessment Tax Assessment Total Assessment is a certain percentage of the fair market value that is determined by local assessors to be the total taxable value of land and additions on the property. | Land | Improvement |
|---|---|---|---|---|
| 2025 | $5,160 | $287,600 | $90,300 | $197,300 |
| 2024 | $5,129 | $278,000 | $90,300 | $187,700 |
| 2023 | $4,820 | $263,100 | $90,300 | $172,800 |
| 2022 | $4,475 | $241,100 | $90,300 | $150,800 |
| 2021 | $4,306 | $223,700 | $90,300 | $133,400 |
| 2020 | $4,035 | $204,700 | $75,300 | $129,400 |
| 2019 | $3,818 | $196,600 | $70,300 | $126,300 |
| 2018 | $3,758 | $187,800 | $65,300 | $122,500 |
| 2017 | $3,414 | $173,900 | $55,300 | $118,600 |
| 2016 | $3,232 | $172,300 | $55,300 | $117,000 |
| 2015 | $3,112 | $172,300 | $55,300 | $117,000 |
Source: Public Records
Map
Nearby Homes
- 36 Joseph Dr
- 51 Anita Dr
- 75 Anita Dr
- 57 Joseph Dr
- 411 E New Lenox Rd
- 851 E New Lenox Rd
- 889 Holmes Rd
- 64 & 68 Brookside Dr
- 76 Alfred Dr
- 25 E New Lenox Rd
- 50 Bellmore Dr
- 59 Bellmore Dr
- 55 Revilla Terrace
- 49 Revilla Terrace
- 4 Filomena Dr
- 59 Joan Dr
- 20 Marshall Ave
- 35 Chapman Rd
- 106 Sampson Pkwy
- 40 Sampson Pkwy